wBPF: Efficient Edge-Case Observability for CXL Pooling systems via eBPF
DOI: https://doi.org/10.1145/3723851.3726985
HCDS '25: 4th Workshop on Heterogeneous Composable and Disaggregated Systems, Rotterdam, Netherlands, March 2025
Today's distributed tracing frameworks struggle to efficiently detect rare edge-case anomalies in large-scale heterogeneous systems employing Compute Express Link (CXL) for memory pooling. Traditional methods—head sampling, which often overlooks critical events, and tail sampling, which incurs significant overhead—fail to balance precision and performance effectively. We introduce wBPF, a lightweight tracing runtime tailored specifically for efficient edge-case observability in CXL-based memory disaggregation. Built upon eBPF, wBPF coordinates tracing across heterogeneous nodes, selectively captures critical memory anomalies, and significantly reduces communication overhead. It integrates container-level deployment, large language models (LLMs) and dynamic runtime verification, enabling rapid identification and resolution of complex memory management issues. Our evaluation shows that wBPF substantially improves edge-case observability with minimal performance impact, making it a valuable tool for troubleshooting memory pooling architectures in modern cloud-native infrastructures.
ACM Reference Format:
Yusheng Zheng, Tong Yu, Yiwei Yang, and Andrew Quinn. 2025. wBPF: Efficient Edge-Case Observability for CXL Pooling systems via eBPF. In 4th Workshop on Heterogeneous Composable and Disaggregated Systems (HCDS '25), March 30, 2025, Rotterdam, Netherlands. ACM, New York, NY, USA 6 Pages. https://doi.org/10.1145/3723851.3726985
1 Introduction
Troubleshooting failures and performance problems in large-scale distributed systems is crucial. Minor performance miss behaviors in a production environment can lead to significant costs[8, 9, 15, 32]. Additionally, the increasing complexity of these systems exacerbates the difficulty of diagnosing issues, demanding substantial effort from system developers and considerable engineering resources. Distributed tracing has emerged as a vital solution for troubleshooting by recording detailed, end-to-end traces of request executions, proving beneficial for a wide range of use cases[22, 28].
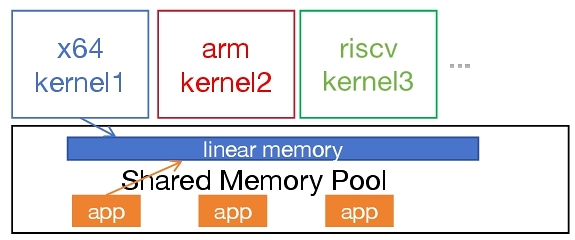
MemVerge[2]’s Project Gismo (Global IO-free Shared Memory Objects) built upon Ray[21] introduces a groundbreaking approach to multi-server shared memory built on top of the Compute Express Link (CXL) standard. By enabling real-time data sharing across multiple servers, Gismo eliminates network IO and data copies—commonly known bottlenecks for distributed, data-intensive applications. At its core, Gismo transforms conventional network and storage pathways into a memory-centric framework, which in turn pushes performance and scaling boundaries for next-generation workloads such as AI/ML, real-time streaming databases, and hybrid transactional/analytical processing (HTAP) engines. Consider a typical scenario where observability agents must monitor network traffic and correlate containerized application behavior across a cloud infrastructure composed of heterogeneous nodes. These nodes might run various kernels, including legacy Linux variants lacking modern eBPF features, mainstream Linux distributions with full eBPF support, and Windows servers with limited BPF capabilities. Additionally, different CPU architectures (e.g., ARM64, x86_64 RISC-V) and diverse runtime environments exacerbate the complexity [12, 17]. They share a CXL pool so that the data sharing of the eBPF trace should also be considered, while Wasm's linear memory model is the best fit for that. Integrating observability capabilities as plugins into comprehensive agents like Deepflow [26] can unify telemetry data across multiple layers, but ensuring seamless portability and optimal performance in such a diverse context remains a formidable challenge [34, 35].
Despite its potential for simplified data movement, Gismo's global memory-sharing model introduces new challenges in observability and troubleshooting. Minor performance degradations or logical errors in a multi-server, memory-centric environment can be notoriously difficult to detect and isolate. Distributed tracing has emerged as a powerful strategy for diagnosing such issues in real time and at scale: We can pinpoint memory anomalies. In a shared memory environment, ephemeral allocations, reference leaks, or stale data references can lead to elusive failures. Tracing instruments individual read/write requests and helps uncover patterns that indicate memory corruption or data consistency violations. We can Understand Cross-Node Interactions. With Gismo, multiple servers interact simultaneously with shared data structures. Distributed tracing captures the causal chain of function calls, data transfers, and synchronization events across the entire cluster, enabling engineers to detect performance hotspots and concurrency issues. We can Tailor Tracing for Low Overhead. Advanced tracing frameworks can apply selective or adaptive sampling, focusing on potential problem areas rather than logging every operation. This strategy is particularly beneficial when debugging sporadic or “edge-case” failures in large-scale memory pooling scenarios, ensuring that overhead remains manageable. We can leverage wBPF to do dynamic analysis and policy compliance. As Gismo is adopted in production environments, policy compliance—such as data governance rules—becomes paramount. Distributed traces can be enriched with metadata for dynamic, real-time checks, alerting operators to any potential breaches, misconfigurations, or unexpected data movements.
To address these challenges, we introduce wBPF, a lightweight runtime built on WebAssembly (Wasm)[5, 13, 24] and the WebAssembly System Interface (WASI)[4]. wBPF offers a standardized, platform-agnostic distribution method for eBPF and control-plane programs, significantly reducing complexity in heterogeneous cloud-native environments. By encapsulating eBPF logic within Wasm modules and interfacing through WASI, wBPF ensures cross-platform compatibility and eliminates the need for environment-specific binaries. This design supports multiple programming languages (e.g., C, Go, Rust) through compatible libraries and toolchains, leveraging Wasm's sandboxing and portability to maintain consistent execution semantics across di÷fferent operating systems and architectures.
In summary, our contributions are:
- Heterogeneous Platform Compatibility:
wBPF provides uniform support for diverse architectures, operating systems, and eBPF runtimes shared the same CXL memory pool through a WASI-based abstraction layer. It employs architecture-aware relocation, BTF preparation, and automatic runtime selection to enable binary-compatible eBPF execution across varied environments.
- Minimal Performance Overhead: We systematically evaluate the additional overhead introduced by wBPF ’s compatibility layer, including in-context BPF-related syscalls, ring buffer operations, and module initialization latency. Our findings indicate that these overheads are manageable, preserving eBPF's characteristic efficiency.
- Accelerated and Simplified Deployment: By seamlessly integrating with container orchestration and toolchains, wBPF offers a streamlined, scalable solution for deploying and managing eBPF programs in heterogeneous, cloud-native environments.
- Enhanced Edge-Case Tracing:
wBPF addresses the limitations of traditional distributed tracing frameworks by enabling efficient capture and analysis of rare edge-case requests with minimal overhead, leveraging semantic probing and dynamic plugin management to balance specificity and performance.
2 Background
2.1 Compatibility Across Diverse Runtimes and Architectures
Although the eBPF instruction set is standardized, the way it is loaded and executed varies widely between kernels (Linux, Windows[20], FreeBSD[1]) and runtimes for the user space (uBPF[16], rBPF[23]). Each environment imposes unique constraints: different system calls, loader APIs, and supported features making it difficult to build a single eBPF program that runs smoothly everywhere. The Linux ecosystem, for example, commonly relies on specialized bpf syscalls and libbpf-based tooling, whereas eBPF on Windows offers a Linux-compatible API wrapper but diverges on kernel functionalities. User-space implementations further fragment the landscape by omitting kernel-specific interfaces like ring buffers or perf events.
While CO-RE helps mitigate kernel-version mismatches by allowing eBPF programs to adapt dynamically through BTF data, its benefits do not fully extend to non-Linux runtimes or to architectural disparities (e.g., differences in pt_regs structures, endianness, and pointer width). Consequently, compatibility becomes a pressing concern in distributed heterogeneous environments—where eBPF must trace edge cases across a mix of OS kernels, user-space runtimes, and processor architectures. Missing or partially implemented features can break observability in isolated nodes, undermine global visibility, or even yield inconsistent data collection. These challenges highlight the difficulty in achieving a uniform eBPF deployment across varied systems, emphasizing the need for solutions prioritizing cross-platform loader interfaces, feature-discovery mechanisms, and architectural abstractions.
2.2 Challenge in Edge Case Identification
In the realm of distributed systems, identifying and diagnosing edge cases—rare and atypical scenarios that deviate from normal operation—is pivotal for maintaining system reliability and performance. Edge cases often emerge under specific, uncommon conditions that may not be anticipated during the initial design and testing phases. These cases can lead to critical failures, degraded performance, or unexpected behaviors that are challenging to reproduce and resolve.
One of the primary challenges in identifying edge cases lies in their inherent rarity. Traditional monitoring and logging mechanisms are typically optimized for capturing aggregate metrics and common failure modes, inadvertently neglecting the subtle anomalies that characterize edge cases. As a result, edge cases may only surface intermittently, making them difficult to detect and analyze without specialized tooling.
Furthermore, the complexity of modern distributed systems, characterized by numerous interacting microservices, intricate network dependencies, and dynamic scaling, exacerbates the difficulty of pinpointing the root causes of edge cases. The non-deterministic nature of these systems means that similar conditions can yield different outcomes, complicating the tracing and replication of edge-case scenarios.
Recent advancements in distributed tracing have shown promise in enhancing edge case identification. Craun and Thompson [7] propose methodologies to eliminate noise within trace data, thereby amplifying the signals that signify edge-case behaviors. By refining trace sampling techniques and employing intelligent filtering mechanisms, their approach ensures that the most pertinent traces—those that may reveal rare and critical issues—are retained for analysis.
Similarly, Zhang and Martinez [31] explore the benefits of adaptive sampling strategies in distributed tracing frameworks. Their research demonstrates that adaptive sampling can dynamically adjust the trace collection rate based on real-time system performance metrics and anomaly detection signals. This flexibility allows for increased trace capture during periods of irregular activity, thereby improving the likelihood of identifying edge cases without incurring significant overhead during normal operations.
Edge case identification is intrinsically linked with temporal provenance and tail-latency troubleshooting. Temporal provenance involves tracking the sequence and timing of events across distributed components, providing a comprehensive view of request flows and interactions. When combined with enhanced tracing techniques, temporal provenance can illuminate the temporal patterns and dependencies that underpin edge-case scenarios.
Tail-latency troubleshooting focuses on addressing the high-percentile latency spikes that can adversely affect user experience. Edge cases often manifest as tail latencies, where a small subset of requests experiences unusually long processing times. By leveraging refined distributed tracing and adaptive sampling, developers can better correlate tail latencies with specific code paths, resource constraints, or network issues that constitute edge cases.
3 Design of wBPF
This section details the design of wBPF, which can package the eBPF application, include userspace control-plane code into a Wasm module, and deploy it either as a standalone container and utilizing existing container tools to deploy eBPF programs or as an embedded runtime, managing eBPF application plugins within host applications.
3.1 Architecture Overview
The architecture of wBPF addresses the challenges associated with deploying eBPF programs across diverse environments, managing their lifecycle in containers, and handling versioning and pluggability. wBPF includes a WebAssembly (Wasm) library, toolchain, and runtime support for loading and executing eBPF programs, ensuring a consistent execution environment regardless of the underlying platform.
In the runtime, a Wasm module can correspond to multiple eBPF programs. An eBPF program instance can be dynamically loaded into the kernel from the Wasm sandbox. This allows the selection of the desired attach point and control over the lifecycle of multiple eBPF bytecode objects. wBPF supports various types of maps and enables bidirectional communication with the kernel, including support for most map types. It efficiently transfers information between kernel and user space through ring buffers polling (or vice versa) and map accesses. wBPF is adaptable to nearly all use cases involving eBPF programs and can evolve and extend as kernel functionality evolves.
3.2 Cross-Platform Compatibility
While eBPF instructions themselves are inherently cross-platform, the userspace control applications that interact with the runtime are typically native binaries. This can lead to compatibility issues across different platforms. wBPF addresses this challenge by leveraging WebAssembly (Wasm) and the WebAssembly System Interface (WASI) for userspace control plane applications, creating a robust and portable compatibility layer.
CO-RE. wBPF also enhances the CO-RE capabilities by incorporating mechanisms to ensure compatibility across different runtimes. This includes automatic BTF downloading in the runtime to ensure that necessary BTF data is available on the host, and provide BTF for userspace eBPF runtimes and host applications. As for a rich tapestry of kernel feature-interoperability issues, we require minor updates to the Wasm runtime code to make them compatible.
Architecture-Independent Relocation. It refers to the process of adjusting the addresses within a program so that it can be executed correctly regardless of the underlying hardware architecture. Unlike architecture-specific relocation, which tailors the relocation process to the nuances of a particular hardware platform, architecture-independent relocation emphasizes portability and flexibility. This approach typically involves using abstract representations of memory addresses and leveraging standardized formats for executable files. By decoupling the relocation process from specific architectures, developers can create more versatile and maintainable software that can be easily adapted to diverse environments. This is especially important in heterogeneous computing systems where software must operate seamlessly across different hardware configurations.
3.3 Semantic Probing
Semantic probing involves analyzing and interpreting the underlying meanings and relationships within data or systems. In the context of software engineering and system design, semantic probing can be utilized to understand the intricacies of code behavior, system interactions, and the effectiveness of various components. By systematically examining the semantics, developers and researchers can identify patterns, optimize performance, and ensure that systems behave as intended under different scenarios. This approach is particularly valuable for debugging, enhancing system reliability, and facilitating the evolution of software architectures. We can find identical kprobe functions or helper functions using LLM manner[33], which resolves the kernel space heterogeneous problem.
4 System Design
In this section, we will cover how we integrate wBPF into a production-ready docker environment and how distributed tracing framework be like for best performance
4.1 wBPF Architecture
eBPF programs are function-based and event-driven, and a specific eBPF program is run when a kernel or user space application passes a hook point. To use an eBPF program, we first need to compile the corresponding source code into BPF bytecode using the clang/LLVM toolchain, which contains the corresponding data structure definitions, maps, and progs definitions. Programs are program segments, and maps can be used to store data or communicate bi-directionally with the user space. After that, we can implement a complete eBPF application with the help of the user state development framework and the loading framework. There's only two part of state WASI that need to be maintained with BPF, kernel state, and userspace state.
- The user state program needs to interact with the kernel through a series of system calls (mainly BPF system calls), create a corresponding map to store data in the kernel state or to communicate with the user state, dynamically select different segments to load according to the configuration, dynamically modify the bytecode or configure the parameters of the eBPF program, load the corresponding bytecode information into the kernel, ensure security through validators, and communicate with the kernel through maps and the kernel, passing data from the kernel state to the user state (or vice versa) through mechanisms such as ring buffer/perf buffer.
- The kernel state is mainly responsible for the specific computational logic and data collection.
wBPF essentially wants to treat the Wasm sandbox as an alternative user-state runtime space on top of the OS, allowing Wasm applications to implement the same programming model and execution logic in the sandbox as eBPF applications that normally run in the user state. wBPF would require a runtime module built on top of the host (outside the sandbox), and some runtime libraries compiled to Wasm bytecode inside the sandbox to provide complete support.
4.2 Tracing Infrastructure
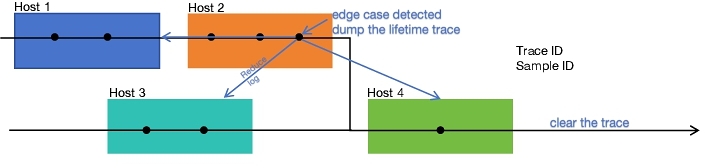
Figure 2 depicts a distributed tracing setup inspired by Hindsight, in which each colored rectangle (blue, orange, teal, green) represents a host participating in the processing of a single request. The horizontal timeline running through these hosts reflects the lifecycle of a trace—uniquely identified by a shared trace ID—as it propagates through the system. At various sampling points (indicated by black circles), telemetry is generated locally on each host.
Common Trace Identifier and Telemetry Stitching. Each time a request arrives at a host, the system either generates a new trace ID or propagates an existing one (as in Hindsight), ensuring the trace remains cohesive across service boundaries. Host 1 (the blue rectangle) collects several data points—spans, metrics, or logs—through Hindsight's lightweight ‘tracepoint‘ calls, buffering them locally rather than immediately ingesting them into a central collector. As the request continues onto Host 2 (orange), more telemetry is accumulated, keyed by the same trace ID.
Meanwhile, Host 3 (teal) might detect an outlier symptom—perhaps an abnormal latency spike or an erroneous status code—which invokes Hindsight's trigger mechanism. This trigger notifies a local agent, which in turn contacts a centralized coordinator to gather the scattered portions of this trace from all hosts that participated in servicing the request. This retrieval of “breadcrumbs” (i.e., references to all machines involved in the trace) ensures that the entire lifetime of the trace can be retroactively sampled and reported—even though the system had not eagerly ingested the data upfront.
In-context Lifetime-Active Heterogeneous Sampling and Log Reduction. When a sufficiently serious anomaly (“edge case”) is detected, Host 2 may decide to “dump the lifetime trace”—effectively firing a trigger to instruct every host holding that trace's data to flush it to a backend trace collector. This action provides operators or automated analysis tools with a complete end-to-end view of how the request flowed through Hosts 1–4.
In parallel, the system may send a “reduce log” signal to Host 3, advising it to scale back logging verbosity. Hindsight easily accommodates such dynamic adjustments to logging levels because local agents can be informed out-of-band; for non-problematic traces, the system simply never reports the collected data and eventually discards it to free up memory. This approach helps avoid both the storage overhead and performance penalties of always capturing high-fidelity trace data.
Clearing Traces and Resource Efficiency. Finally, once the trace reaches Host 4 (green), the system can “clear the trace” upon confirming that no further triggers are required, thereby releasing resources. Here again, Hindsight's lazy ingestion model means that any untriggered traces are eventually evicted from local buffers in bulk, preventing fragmented partial-data scenarios that lead to incoherent traces. Crucially, if no triggers occur, the trace never leaves local memory—no cost is paid in shipping unused data to external collectors.
By weaving these principles into an In-context Lifetime Active Sampling approach, developers gain the dual benefits of selective, on-demand retrieval of traces during edge cases, alongside 100% coverage (i.e., every request is potentially traceable). This design balances deep observability with minimal resource footprint because high-volume, “normal” traces do not burden the backend, while atypical traces undergo rapid ingestion and detailed analysis when needed.
5 Evaluation
| Program | Linux 5.5 | Linux 6.10 | Linux 6.10 arm64 | Windows | Userspace eBPF |
| bootstrap | -/O | X/O | X/O | -/- | -/- |
| lsm | -/- | X/O | X/O | -/- | -/- |
| opensnoop | X/O | X/O | X/O | -/- | -/O |
| sockops | X/O | X/O | X/O | -/O | -/- |
| kprobe | X/O | X/O | -/O | -/- | -/- |
| uprobe | X/O | X/O | -/O | -/- | -/O |
| xdp | X/O | X/O | X/O | -/- | -/O |
We implemented wBPF using approximately 1386 lines of Rust code and 510 lines of C++ code to answer the following research questions: the effectiveness of wBPF and its compatibility. The toolchain includes a modified version of bpftool, which generates eBPF skeletons for development and facilitates serialization-free communication between the eBPF runtime and the Wasm runtime. To enable the development of eBPF programs within a Wasm environment, we implemented the wBPF library in C, Go, and Rust (e.g., libbpf-wasm). This library interacts with the WASI interface and loads eBPF bytecode into the eBPF runtime. Additionally, we built the wBPF runtime on top of WasmEdge[18], enabling interaction with the eBPF runtime and integration with container tools. The test environment includes an AMD Epyc 7742 @ 2.0GHz and we emulate CXL pool access using socket.
5.1 Efficiency and Completeness
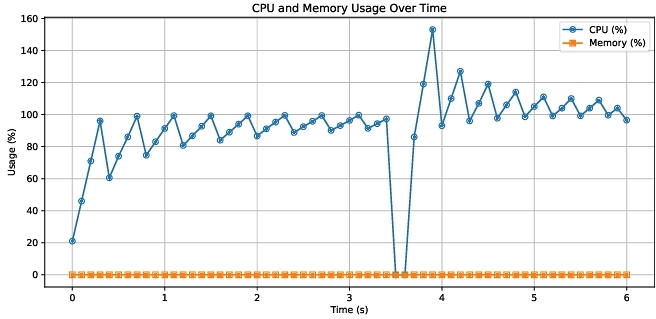
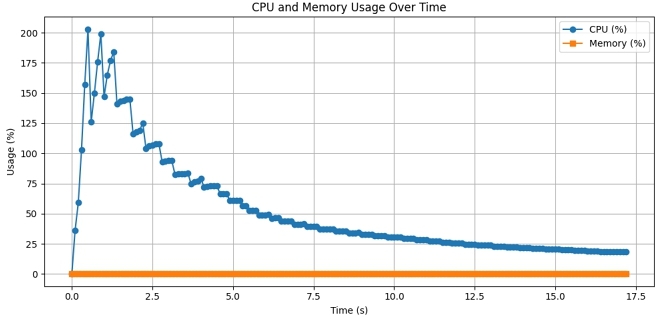
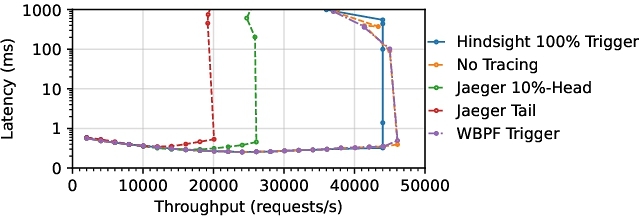
5.1.1 Micro benchmark Results. In this efficiency and completeness experiment, we incorporate network observability, system profiling, and dynamic plugin management into a single workflow to see how these elements interact and affect system performance. We begin by loading an eBPF program (using either a native loader or a WebAssembly-based wBPF control plane) that inspects high-volume incoming traffic and collects network metrics such as packet counts and latencies. Simultaneously, we attach additional eBPF probes to kernel tracepoints—such as sched events—to capture frequent context switches or process forks, thereby generating a steady flow of system-level events. Finally, we introduce dynamic plugin management by periodically loading and unloading other eBPF modules, including a disk I/O tracing program, to evaluate how quickly probes can be swapped out and whether such actions affect ongoing data capture. We measure CPU usage, memory overhead, event throughput, and response times for key actions like loading or unloading plugins. To track resource usage, we continuously run a monitoring tool (e.g., top) and record CPU and memory utilization as new eBPF modules start processing data. In addition, we tally the total event count over time to gauge how effectively the system intercepts both network and kernel tracepoint activity. The load and unload times for eBPF plugins are also monitored to see if the transition disrupts existing measurements. Figures 4 and 3 shows the extra CPU usage is less than 2 cores and extra Memory usage is nearly zero. In throughput vs. latency micro brick benchmarks in graph Figure 5, WBPF Trigger method performs nearer than hindsight to the native tracing.
5.2 Compatibility
To evaluate the compatibility of wBPF, we tested various eBPF programs across different platforms, including multiple Linux versions, Windows, and userspace eBPF environments. The platforms considered include Linux 5.5, Linux 6.10, Linux 6.10 on ARM64 architecture, Windows, and userspace eBPF. The matrix in Table 1 provides a view of the support for each eBPF program in both native and wBPF environments. The symbols used in the table are "X" for native eBPF and "O" for wBPF, while "-" indicates that the platform is not applicable.
The compatibility results demonstrate that wBPF can effectively run various eBPF programs across different platforms, ensuring binary-level compatibility.
5.3 Comparative Analysis
Compared to other embedded Wasm runtimes [3, 14, 19, 27], which typically rely on ad-hoc, ioctl-style interfaces for memory management and hardware access [6, 25, 29, 30], WALI offers a more structured and unified application binary interface (ABI). This approach transcends heterogeneous platforms [10, 11], providing a consistent and well-defined model that accommodates diverse hardware and resource constraints. By standardizing the interaction between Wasm modules and the host system, WALI reduces fragmentation and enhances interoperability, which is crucial for effective edge tracing and observability across varied environments.
6 Conclusion
This paper introduced wBPF, a system leveraging WebAssembly (Wasm) and the WASI's standardized system interface to address the challenges of deploying eBPF programs across diverse environments. wBPF ensures cross-platform compatibility, eliminates serialization overhead and introduces minimal overhead. It integrates seamlessly with container tools, simplifying the deployment and orchestration of eBPF programs within containerized ecosystems.
Acknowledgments
The authors wish to acknowledge the use of Claude in the writing of this paper. This tool was used to assist with improving the language in the paper and providing translations on implementations section.
References
- [n. d.]. eBPF Support in FreeBSD. https://wiki.freebsd.org/BPF.
- 2024. MemVerge Launches Project Gismo, to Revolutionize Distributed Applications. https://hostingjournalist.com/news/memverge-launches-project-gismo-to-revolutionize-distributed-applications.
- P. et al. Abrahamsson. 2019. Serverless at the Edge. In ACM SIGSOFT International Workshop on Serverless Computing.
- WASI author. 2023. WASI: WebAssembly System Interface. GitHub repository. https://github.com/WebAssembly/WASI.
- WebAssembly Authors. 2024. WebAssembly Specifications. https://webassembly.github.io/spec/.
- M. Bokhari. 2019. Stream Synchronization in Edge-IoT Scenarios. ACM Transactions on Internet Technology (TOIT) (2019).
- Milo Craun, Khizar Hussain, Uddhav Gautam, Zhengjie Ji, Tanuj Rao, and Dan Williams. 2024. Eliminating eBPF Tracing Overhead on Untraced Processes. In Proceedings of the ACM SIGCOMM 2024 Workshop on eBPF and Kernel Extensions. 16–22.
- Datapath.io. 2022. Recent AWS Outage and How You Could Have Avoided Downtime. https://medium.com/@datapath_io/recentaws-outage-and-how-you-could-have-avoideddowntime-7d9d9443d776. Retrieved April 2022.
- Jeffrey Dean and Luiz André Barroso. 2013. The Tail at Scale. Commun. ACM 56, 2 (2013), 74–80. 10.1145/242787.242796
- D. Engler, M. F. Kaashoek, and J. O'Toole. 1995. Exokernel: An Operating System Architecture for Application-level Resource Management. In ACM Symposium on Operating Systems Principles (SOSP). 251–266.
- B. et al. Ford. 1999. Vortex: Enforcing Context-Sensitive Security Policies. In IEEE Symposium on Security and Privacy.
- Brendan Gregg. 2020. BPF Performance Tools. Addison-Wesley.
- Andreas Haas, Andreas Rossberg, Derek L Schuff, Ben L Titzer, Michael Holman, Dan Gohman, Luke Wagner, Alon Zakai, and JF Bastien. 2017. Bringing the web up to speed with WebAssembly. In Proceedings of the 38th ACM SIGPLAN Conference on Programming Language Design and Implementation. 185–200.
- H. et al. Hu. 2020. Security Analysis of WebAssembly-based IoT Deployments. arXiv preprint arXiv:2006.00000.
- IHS. 2016. Businesses Losing $700 Billion a Year to IT Downtime, Says IHS. https://www.businesswire.com/news/home/20160125005188/en/Businesses-Losing-700-Billion-a-Year-to-IT-Downtime-Says-IHS. Retrieved April 2022.
- iovisor. 2024. Userspace eBPF VM. https://github.com/iovisor/ubpf.
- Rafael Jeronimo et al. 2022. KFS: Kernel Function Slicing for Fine-Grained Observability. In USENIX ATC.
- Ju Long, Hung-Ying Tai, Shen-Ta Hsieh, and Michael Juntao Yuan. 2020. A lightweight design for serverless function as a service. IEEE Software 38, 1 (2020), 75–80.
- N. et al. Mäkitalo. 2021. WebAssembly Modules as Lightweight Containers for the Edge. In ACM International Conference on Mobile Software Engineering and Systems (MobileSoft).
- microsoft. 2024. eBPF for Windows. https://github.com/microsoft/ebpf-for-windows.
- Philipp Moritz, Robert Nishihara, Stephanie Wang, Alexey Tumanov, Richard Liaw, Eric Liang, Melih Elibol, Zongheng Yang, William Paul, Michael I Jordan, et al. 2018. Ray: A distributed framework for emerging { AI} applications. In 13th USENIX symposium on operating systems design and implementation (OSDI 18). 561–577.
- Austin Parker, Daniel Spoonhower, Jonathan Mace, Ben Sigelman, and Rebecca Isaacs. 2020. Distributed tracing in practice: Instrumenting, analyzing, and debugging microservices. O'Reilly Media.
- qmonnet. 2024. Rust virtual machine and JIT compiler for eBPF programs. https://github.com/qmonnet/rbpf.
- A. Ramesh, L. Aphecetche, D. Lazar, and B. Ford. 2023. Stop Passing the Buck: Off-by-Default Trust for Heterogeneous IoT and Edge Devices. In USENIX Security.
- D. et al. Retterer. 2017. Edge Computing Instrumentation. In IEEE Edge Computing.
- Junxian Shen, Han Zhang, Yang Xiang, Xingang Shi, Xinrui Li, Yunxi Shen, Zijian Zhang, Yongxiang Wu, Xia Yin, Jilong Wang, et al. 2023. Network-Centric Distributed Tracing with DeepFlow: Troubleshooting Your Microservices in Zero Code. In Proceedings of the ACM SIGCOMM 2023 Conference. 420–437.
- A. et al. Shieh. 2020. Embedding WebAssembly in IoT Devices. In Workshop on Edge Systems.
- Yuri Shkuro. 2019. Mastering Distributed Tracing: Analyzing performance in microservices and complex systems. Packt Publishing Ltd.
- J. Winton. 2016. Tools for IoT Hardware Abstraction. ACM IoT SIG.
- L. et al. Yang. 2021. Adaptive Synchronization for Edge-based IoT Services. IEEE Transactions on Services Computing (2021).
- Lei Zhang, Zhiqiang Xie, Vaastav Anand, Ymir Vigfusson, and Jonathan Mace. 2023. The Benefit of Hindsight: Tracing { Edge-Cases} in Distributed Systems. In 20th USENIX Symposium on Networked Systems Design and Implementation (NSDI 23). 321–339.
- Yazhuo Zhang, Rebecca Isaacs, Yao Yue, Juncheng Yang, Lei Zhang, and Ymir Vigfusson. 2023. LatenSeer: Causal Modeling of End-to-End Latency Distributions by Harnessing Distributed Tracing. In Proceedings of the 2023 ACM Symposium on Cloud Computing. 502–519.
- Yusheng Zheng, Yiwei Yang, Maolin Chen, and Andrew Quinn. 2024. Kgent: Kernel extensions large language model agent. In Proceedings of the ACM SIGCOMM 2024 Workshop on eBPF and Kernel Extensions. 30–36.
- Yang Zhou, Zezhou Wang, Sowmya Dharanipragada, and Minlan Yu. 2023. Electrode: Accelerating Distributed Protocols with { eBPF}. In 20th USENIX Symposium on Networked Systems Design and Implementation (NSDI 23). 1391–1407.
- Yang Zhou, Xingyu Xiang, Matthew Kiley, Sowmya Dharanipragada, and Minlan Yu. 2024. { DINT} : Fast { In-Kernel} Distributed Transactions with { eBPF}. In 21st USENIX Symposium on Networked Systems Design and Implementation (NSDI 24). 401–417.

This work is licensed under a Creative Commons Attribution 4.0 International License.
HCDS '25, Rotterdam, Netherlands
© 2025 Copyright held by the owner/author(s).
ACM ISBN 979-8-4007-1470-2/25/03.
DOI: https://doi.org/10.1145/3723851.3726985