Behavioral Fingerprints for LLM Endpoint Stability and Identity
DOI: https://doi.org/10.1145/3786335.3813194
CAIS '26: ACM Conference on AI and Agentic Systems, San Jose, CA, USA, May 2026
The consistency of AI-native applications depends on the behavioral consistency of the model endpoints that power them. Traditional reliability metrics such as uptime, latency and throughput do not capture behavioral change, and an endpoint can remain “healthy” while its effective model identity changes due to updates to weights, tokenizers, quantization, inference engines, kernels, caching, routing, or hardware. We introduce Stability Monitor, a black-box stability monitoring system that periodically fingerprints an endpoint by sampling outputs on a fixed prompt set and comparing the resulting output distributions over time. Fingerprints are compared using a summed energy distance statistic across prompts, with permutation-test p-values as evidence of distribution shift aggregated sequentially to detect change events and define stability periods. In controlled validation, Stability Monitor detects changes to model family, version, inference stack, quantization, and sampling parameters. In real-world monitoring of the same model hosted by multiple providers, we observe substantial provider-to-provider and within-provider stability differences.
ACM Reference Format:
Jonah Leshin, Manish Shah, Ian Timmis, and Daniel Kang. 2026. Behavioral Fingerprints for LLM Endpoint Stability and Identity. In ACM Conference on AI and Agentic Systems (CAIS '26), May 26--29, 2026, San Jose, CA, USA. ACM, New York, NY, USA 5 Pages. https://doi.org/10.1145/3786335.3813194
1 Introduction
1.1 Reliability is not stability
The software deployment intuition “if it's up and fast, it's fine” is insufficient for AI-native systems: an endpoint can pass standard health checks while its outputs drift, shifting formatting, tone, or tool behavior in ways that break downstream parsers and guardrails. Stability failures are particularly impactful in multi-step agentic workflows, where small variance in early steps can compound into large workflow variance. This motivates stability as a distinct operational metric: behavioral consistency of a model endpoint under a fixed interface contract.
Even if users fix visible settings (e.g., temperature), endpoint behavior can vary due to system-level nondeterminism “beneath the surface”: variance in inference engines, kernels, caching, batch sizes, and hardware—and providers may route requests across heterogeneous environments. The values of these factors at run time may be a function of overall system load, which the user cannot control, thus making the endpoint nondeterministic from the user's perspective [4].
These system-level factors, which can result in nondeterministic behavior even at temperature 0, must be considered on top of discrete, deliberate updates such as a model version change, undermining reproducibility in both production and evaluation environments. Evaluation instability and provider effects are now recognized as a major source of variance in benchmarking results [1].
1.2 Contribution and scope
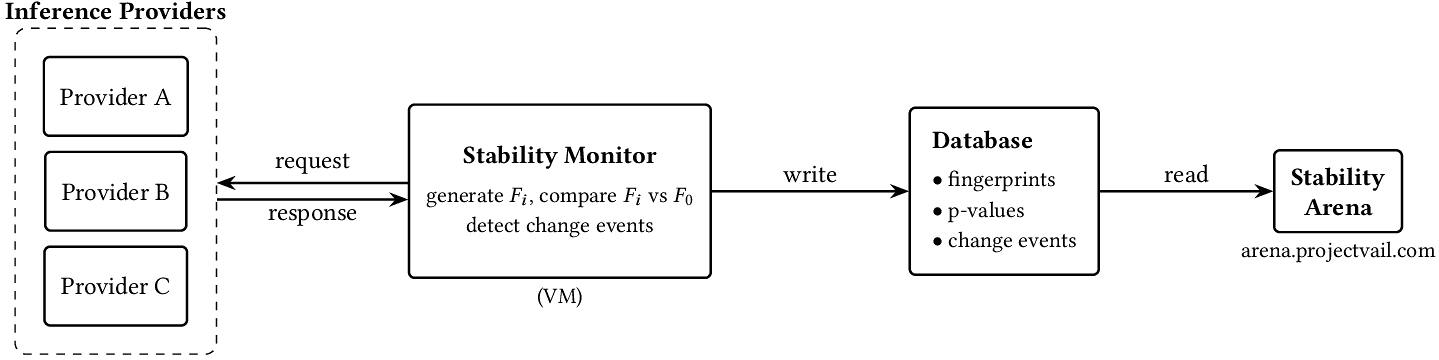
We introduce two components: Stability Monitor, which continuously fingerprints endpoints and detects behavioral change events, and Stability Arena, a web application that publishes and visualizes the data that Stability Monitor produces. Together, the goal is to operationalize continuous stability monitoring under realistic constraints:
- Black-box: observe only public API I/O; no privileged access to weights or provider internals.
- Lightweight and frequent: monitor at high cadence versus heavy periodic evals (motivating the notions of stability periods and change events).
- Actionable: produce audit trails and change event alerts usable by engineering, security, and compliance.
We contribute:
- A practical fingerprinting and change-detection pipeline based on energy-distance permutation testing and sequential evidence aggregation.
- Controlled validation across multiple real-world change types.
- Real-world provider comparisons for the same nominal model showing large cross-provider and within-provider stability differences, motivating “same model, different behavior” as an operational reality.
2 Background and related work
Chen et al. [3] documented significant behavioral drift in GPT-3.5 and GPT-4 between March and June 2023, showing that model performance on specific tasks could degrade substantially across updates. He et al. [4] characterized the system-level causes of endpoint nondeterminism, including load-induced batch-size variation and non-batch-invariant kernels, and Epoch [1] identified evaluation instability and provider effects as major sources of variance in benchmarking results. Wang and Wang [9] assessed the reproducibility of LLM outputs across repeated runs, finding that complex tasks exhibit substantial variability. These works document the problem of LLM behavioral inconsistency but do not provide systems for continuous operational monitoring or change detection.
Chauvin et al. [2] propose B3IT, a black-box method for detecting changes in LLM APIs using “border inputs”, which are prompts where multiple tokens are nearly tied as the top prediction. Like our approach, B3IT is grounded in hypothesis testing of whether the underlying output distribution has changed. However, B3IT requires devising custom probe inputs for each endpoint being monitored, and after a change event the probes may need to be re-derived for the new model state. Our approach uses a fixed, endpoint-agnostic prompt set that does not require per-endpoint customization or re-derivation after changes.
Our statistical approach to measuring behavioral change is complementary to projects that run domain-specific evaluations over time [5, 6]. These efforts offer a signal about specific abilities over time, but are typically expensive to run, limiting the feasibility of coverage across a range of models and providers.
Our approach builds on the energy distance statistic as the core metric for comparing samples of response embeddings, a nonparametric distance between distributions that is zero if and only if the distributions match under mild conditions [8]. We use sequential evidence accumulation based on e-values (expectation-bounded test statistics) to enable continuous monitoring with optional stopping behavior, suited for streaming detection settings [7, 10].
3 Problem definition
In the context of text-to-text models, we define endpoint stability as distributional consistency of responses under a fixed prompt set and fixed user-visible settings. We treat the endpoint as a black box. Endpoint instability may occur due to changes to:
- model identity (family, version, tokenizer, weights),
- deployment (inference engine, stack),
- optimization techniques (quantization, caching, kernels, speculative decoding),
- configurations (sampling parameters, system prompts)
Our objective is to detect when there has been a change in the endpoint's effective output distribution and to create an audit trail of change events and stability periods.
4 Methodology: fingerprints and change detection
4.1 Fingerprint construction
A fingerprint is constructed by selecting a fixed set of prompts and sampling multiple responses per prompt; the first token of each response is embedded as a real-valued vector using a fixed subword embedding.1 A fingerprint thus consists of a set of sets of vectors—one sample set per prompt. Our implementation requires a total of 800 inference requests, each consisting of a few tokens, to be made to an endpoint to generate a fingerprint.
4.2 Pairwise fingerprint comparisons
Given fingerprints X and Y, we compute an energy distance statistic per prompt between the prompt-specific embedding samples, and sum across prompts to produce an aggregate distance E = E(X, Y).
To test the null hypothesis that two fingerprints are drawn from the same underlying distribution, we compute a p-value via a permutation test on the aggregate statistic E. To compute the p-value, the embedding vectors for each prompt are pooled and randomly re-split into two groups of the original sizes according to a permutation π on the pooled set of vectors, yielding a permuted statistic Eπ. The p-value is the fraction of permutations for which Eπ ≥ E when this comparison is done across a set of randomly selected permutations. Lower p-values indicate stronger evidence of change.
4.3 Fingerprint comparisons over time
Monitoring of an endpoint begins by generating a baseline fingerprint F0. At a regular cadence we generate new fingerprints Fi at time ti and compute the aforementioned p-value pi = p(F0, Fi). Each time a new fingerprint Fi is generated, using the e-values methods from [7, 10] applied to the sequence of p-values p1,..., pi, we assess the cumulative evidence for a change in the endpoint's effective output distribution since the time of the baseline fingerprint. If the evidence exceeds a predetermined threshold, we declare a change event and set the most recent fingerprint as the new baseline, to which subsequent fingerprints are compared.
5 System: Stability Monitor and Stability Arena
Stability Monitor runs continuously against an endpoint:
- generate baseline fingerprint F0,
- at regular cadence (typically every few hours) generate Fi,
- compute pi = p(F0, Fi),
- update sequential evidence and detect change events,
- write an audit log of stability periods and events.
Stability Arena (https://arena.projectvail.com)2 publishes stability data across endpoints and supports cross-provider comparisons for the same nominal model. Endpoint metadata, fingerprints, p-values, and change events are stored in a cloud Postgres database from which Stability Arena reads.
The web interface exposes several views. A provider matrix shows cumulative change event counts per endpoint over time, giving an at-a-glance picture of which providers have been most and least stable. Per-endpoint views surface the full change event history alongside traditional operational metrics such as latency and error rates, situating behavioral stability in the context of conventional reliability signals. A cross-provider comparison view shows each provider's deviation from the pooled behavior of all providers serving the same nominal model, making it straightforward to identify outlier provider behavior.
5.1 Cost and performance considerations
Since only the first token of each response is used for fingerprinting, the output token limit can typically be set low (e.g., 10 tokens), substantially reducing per-request cost. However, this must be configured per endpoint, as some models return empty responses when the token limit is too low for the model to produce a useful answer.
Fingerprint generation parallelizes across prompts, with each thread handling all repeated samples for a single prompt. We chose levels of concurrency based on explicit endpoint rate limits and observed latency. We found that anywhere from one to four concurrent threads enabled us to generate fingerprints quickly enough without overloading the target endpoint. A typical fingerprint could be generated within ten minutes, although outlier cases with aggressive rate limiting or abnormally high latency could take up to several hours.
5.2 Demo scenario
At the live demonstration, attendees will inspect current stability data for endpoints serving the most widely deployed models. The demo will walk through the provider matrix to show recent change event trends, drill into a per-endpoint view to examine stability periods and change events in context, and use the cross-provider comparison to highlight providers whose behavior diverges from the consensus for the same model. Because Stability Arena runs continuously against live endpoints, the data shown will reflect the latest real behavior rather than a static snapshot.
6 Findings: controlled methodology validation
6.1 Experimental setup
Validation experiments were run by hosting a model at a local endpoint. In an independent process, we ran Stability Monitor, generating fingerprints via API calls to the local endpoint at an hourly cadence. Once Stability Monitor had generated a few fingerprints, we made a discrete change to the model hosted at the local endpoint without modifying Stability Monitor. Stability Monitor continued to run, generating fingerprints, unaware of the change that had been made to the endpoint.
We tested five change types, with examples of each shown in Table 1. Each change was evaluated on its own, holding the other change types constant.
| Change type | Example Intervention |
|---|---|
| Model family | Qwen → Llama |
| Version upgrade | Qwen2.5-0.5B → Qwen3-0.6B |
| Inference stack | vLLM → Transformers |
| Quantization | Qwen2.5-14B BF16 → Qwen2.5-14B INT8 |
| Temperature | 0.7 → 0.6 |
6.2 Results
With one exception, each endpoint change produced a change event immediately on the next fingerprint; the exception was a small temperature change (0.7 → 0.6), which took 18 fingerprints after the change was made to trigger a change event.
Moreover, Stability Monitor recorded exactly one change event per intervention: the periods both before and after the change detection were stable. That is, there were no false positives—no instances in which a change event was incorrectly triggered in the absence of an actual change.
7 Findings: cross-provider comparisons for the same model
VAIL's fingerprints support comparisons of different endpoints serving the same nominal model in two modes: (a) pairwise comparisons over shared time windows, and (b) individual endpoint divergence relative to a group of endpoints.
7.1 Pairwise provider similarity (heatmap)
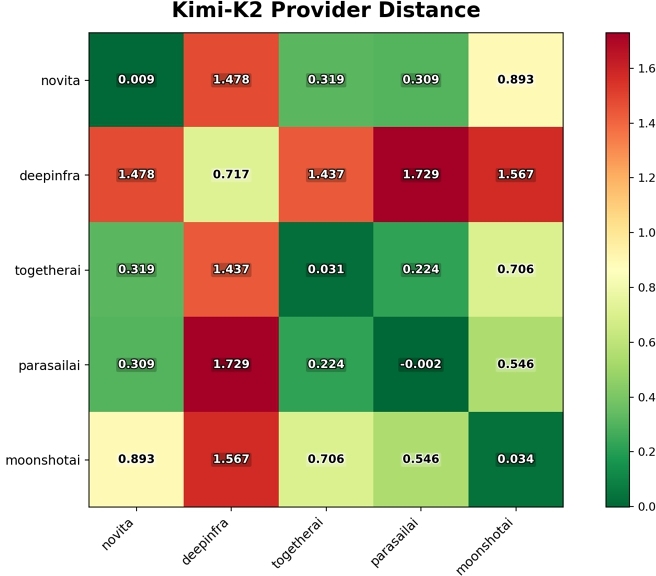
In the case of (a), we consider multiple providers serving the same nominal model over a shared time period and perform pairwise fingerprint comparisons using energy distance to form a distance matrix. One application is provider identification: given an endpoint serving a model known to be among a set of candidate providers, we can determine which provider is serving it by fingerprinting the endpoint and comparing against the candidates. In Figure 2, the diagonal entries are the minimum in each row and column, confirming that a provider's fingerprints are most similar to its own—and therefore that nearest-neighbor comparison against known-provider fingerprints reliably identifies the serving provider.3 We can likewise perform the above analysis over a sequence of consecutive shared time windows, enabling us to measure pairwise provider similarity over time.
7.2 Individual endpoint divergence
For the case of (b), we propose a “provider vs the pack” deviation score in which we compare one provider's fingerprints to the pooled distribution of all other providers’ fingerprints for the same model over matched time windows. We normalize each provider-vs-pack distance by the median across all providers to produce a divergence ratio. For example, a provider with a divergence ratio of 2 is twice as different from the pooled distribution as the median provider is.
In the Stability Arena “Provider Comparisons” tab we compute this divergence ratio daily and plot its values over time, enabling us to identify which providers diverge from the consensus and when. Because the metric is normalized by the median, it is sensitive to individual outliers rather than uniform shifts; a rolling model update that propagates unevenly across providers would appear as a sequence of outlier spikes.
8 Findings: real-world deployment stability examples
In production monitoring of the Kimi-K2-0905-Instruct model across providers, Stability Monitor observed that in November 2025, one provider (DeepInfra) was least stable—nearly every fingerprint generation resulted in an output distribution that triggered a change event. On the other hand, the endpoint hosted by the model's creator (Moonshot) showed 100% stability.
In December 2025, when Stability Monitor flagged a model change event for Parasail, the Parasail team confirmed a hardware-provider switch had been made due to a physical node failure.
9 Caveats and limitations
Even for a fixed model, inference execution specifications (engine, kernels, caching, speculative decoding, hardware) can affect next-token probabilities and token selection; providers may route/batch requests across heterogeneous environments, inducing ongoing randomness that complicates attribution and can blur the line between “change event” and “always somewhat unstable.”
This is consistent with systems work arguing that endpoint nondeterminism is often driven by load-induced batch-size variation interacting with non-batch-invariant kernels [4]. Stability Monitor is designed to detect endpoint-level changes, and endpoint-level variance can be a product of these execution-level factors.
10 Conclusion
Behavioral instability raises security and compliance concerns: if a model changes silently, prior safety validation and guardrails may no longer apply. Stability monitoring provides an audit trail of when behavior changed.
Operationally, Stability Arena also surfaces that “the same model” served by different providers can exhibit different behavioral characteristics due to provider infrastructure choices; this matters for selecting production providers and for interpreting benchmark or eval results that depend on provider access paths. To assess stability over an extended period, one can examine the total number of change events or the ratio of change events to total fingerprints. An endpoint exhibiting frequent change events may warrant switching to a different provider for the same model, or to a different model entirely.
Future research tracks include extending fingerprinting to task- or domain-specific prompt sets, providing stability signals in a narrower context closer to targeted use cases.
References
- Florian Brand and Jean-Stanislas Denain. 2025. Why Benchmarking is Hard. https://epoch.ai/gradient-updates/why-benchmarking-is-hard/. Accessed: 2026-03-10.
- Timothée Chauvin, Clément Lalanne, Erwan Le Merrer, Jean-Michel Loubes, François Taïani, and Gilles Tredan. 2026. Token-Efficient Change Detection in LLM APIs. arXiv preprint arXiv:2602.11083 (2026).
- Lingjiao Chen, Matei Zaharia, and James Zou. 2024. How Is ChatGPT's Behavior Changing over Time?Harvard Data Science Review 6, 2 (2024). https://doi.org/10.1162/99608f92.5317da47 https://hdsr.mitpress.mit.edu/pub/y95zitmz.
- Horace He and Thinking Machines Lab. 2025. Defeating Nondeterminism in LLM Inference. Thinking Machines Lab: Connectionism (2025). https://doi.org/10.64434/tml.20250910 https://thinkingmachines.ai/blog/defeating-nondeterminism-in-llm-inference/.
- Margin Research. 2025. Claude Code Historical Performance Tracker. https://marginlab.ai/trackers/claude-code-historical-performance/.
- Jacob Phillips. 2025. daily-bench. https://github.com/jacobphillips99/daily-bench.
- Aaditya Ramdas and Ruodu Wang. 2025. Hypothesis Testing with E-values.
- Gábor J. Székely and Maria L. Rizzo. 2013. Energy Statistics: A Class of Statistics Based on Distances. Journal of Statistical Planning and Inference 143, 8 (2013), 1249–1272. https://doi.org/10.1016/j.jspi.2013.03.018
- Jingze Wang and Nan Wang. 2025. Assessing Consistency and Reproducibility in the Outputs of Large Language Models: Evidence Across Diverse Finance and Accounting Tasks. arXiv preprint arXiv:2503.16974 (2025).
- Ruodu Wang. 2023. A Tiny Review on E-values and E-processes. Technical Report. University of Waterloo.
Footnote
1For reasoning models that emit a thinking block (e.g., wrapped in <think> tags) before the visible response, the thinking block is stripped and the first token of the actual response content is used.
2Demo video: https://www.loom.com/share/cd3dc953f1df4d11b158677da0f66be7.
3A diagonal entry can be slightly negative because the finite-sample unbiased energy statistic $2\,\mathbb {E}\Vert X{-}Y\Vert - \mathbb {E}\Vert X{-}X^{\prime }\Vert - \mathbb {E}\Vert Y{-}Y^{\prime }\Vert$ can dip below zero when sampling noise causes the within-fingerprint spread terms to slightly exceed the cross-fingerprint term; in the population limit the statistic is non-negative and equals zero when the distributions match.

This work is licensed under a Creative Commons Attribution 4.0 International License.
CAIS '26, San Jose, CA, USA
© 2026 Copyright held by the owner/author(s).
ACM ISBN 979-8-4007-2415-2/26/05.
DOI: https://doi.org/10.1145/3786335.3813194