eGPU: Extending eBPF Programmability and Observability to GPUs
DOI: https://doi.org/10.1145/3723851.3726984
HCDS '25: 4th Workshop on Heterogeneous Composable and Disaggregated Systems, Rotterdam, Netherlands, March 2025
Precise GPU observability and programmability are essential for optimizing performance in AI workloads and other computationally intensive high-performance computing (HPC) applications. In this paper, we introduce eGPU, the first framework and eBPF runtime that dynamically offloads eBPF bytecode onto GPUs via dynamic PTX injection. Designed primarily for observability, our system leverages real-time GPU telemetry, eBPF-based dynamic instrumentation, and automated performance analysis to pinpoint bottlenecks at multiple layers—including kernel execution, memory transfers, and heterogeneous compute orchestration—without incurring significant overhead or interrupting active GPU kernels. By dynamically compiling eBPF programs into PTX snippets and injecting them directly into running GPU kernels, eGPU provides fine-grained, low-overhead instrumentation that seamlessly integrates with existing eBPF ecosystems. Our initial micro-benchmark evaluation demonstrates that eGPU achieves low instrumentation overhead while providing high-resolution performance insights. Ultimately, eGPU opens a pathway toward future programmable GPU infrastructures capable of dynamically adapting to diverse and evolving workload requirements.
ACM Reference Format:
Yiwei Yang, Tong Yu, Yusheng Zheng, and Andrew Quinn. 2025. eGPU: Extending eBPF Programmability and Observability to GPUs. In 4th Workshop on Heterogeneous Composable and Disaggregated Systems (HCDS '25), March 30, 2025, Rotterdam, Netherlands. ACM, New York, NY, USA 7 Pages. https://doi.org/10.1145/3723851.3726984
1 Introduction
The rapid growth of data-intensive and computationally demanding workloads—ranging from large-scale machine learning and high-performance computing (HPC) simulations [10, 13, 19] to graphics rendering [12] and large language models [6]—has increasingly relied on GPU acceleration to achieve desired performance and throughput. As these GPU-powered systems scale, precise observability and low-overhead instrumentation become essential for diagnosing performance bottlenecks, optimizing resource usage, and identifying anomalous behavior at runtime.
Existing GPU instrumentation approaches, such as NVIDIA's CUDA Profiling Tools Interface (CUPTI) [11] and binary-instrumentation frameworks like NVBit [14], offer insights into GPU performance but often incur substantial overhead or require invasive modifications that interrupt GPU kernels. Meanwhile, Linux's extended Berkeley Packet Filter (eBPF) has emerged as a powerful observability framework, traditionally employed in network analytics [5] and system profiling [16, 18]. eBPF allows lightweight, sandboxed instrumentation programs to execute in kernel space without intrusive kernel changes or performance penalties. However, existing eBPF techniques remain CPU-centric, constrained by frequent kernel-user space context switches and limited visibility into the GPU execution model.
Applying eBPF to GPU workloads presents unique challenges: GPU execution models feature asynchronous kernel launches, parallel thread execution, and specialized memory hierarchies, making instrumentation significantly more complex and prone to high overhead. Furthermore, eBPF's inherent CPU-centric design does not directly extend to GPU hardware without novel translation and runtime adaptation strategies.
To bridge this gap, we introduce eGPU, the first observability framework and eBPF runtime that dynamically extends eBPF instrumentation into GPU kernels via runtime PTX injection. Specifically, eGPU compiles eBPF bytecode into NVIDIA's Parallel Thread Execution (PTX) intermediate representation at runtime and injects this instrumentation directly into actively executing GPU kernels. Leveraging user-space eBPF uprobes, shared-memory maps, and real-time GPU telemetry, eGPU provides fine-grained GPU instrumentation with minimal runtime overhead. Unlike previous GPU profiling solutions, our approach allows instrumentation to be dynamically added, modified, or removed when running GPU kernels without interrupting their execution.
Moreover, while initially demonstrated through precise GPU observability, the broader significance of dynamically injecting eBPF onto GPUs extends beyond instrumentation alone. Our methodology opens a window for programmable GPU computing, potentially enabling adaptive runtime kernel optimizations, dynamic GPU resource management, real-time security policy enforcement, and other novel runtime GPU modifications previously inaccessible to existing static or high-overhead instrumentation approaches. The code is open-sourced under the https://github.com/victoryang00/bpftime-super repo.
In summary, we make the following core contributions:
- We introduce eGPU, the first system to dynamically offload eBPF instrumentation and bytecode directly onto running GPU kernels using real-time PTX injection, significantly reducing instrumentation overhead compared to existing methods.
- We detail the design and implementation of eGPU, which integrates kernel-level and user-space eBPF instrumentation hooks, runtime PTX generation, and shared-memory synchronization, providing a seamless, low-overhead observability platform for modern HPC and AI workloads.
- We evaluate eGPU through initial micro-benchmark experiments measuring GPU memory access latency instrumentation, demonstrating practical low overhead and high-resolution insights into GPU execution.
- We discuss broader implications and future possibilities enabled by eGPU, highlighting its potential as a foundational infrastructure for dynamic GPU computing, runtime optimization, and GPU security.
The rest of the paper proceeds as follows. We first discuss related work in eBPF, GPU observability, and large-scale system instrumentation in §3. Next, we present the detailed design and implementation of eGPU in §5. We then provide an in-depth evaluation in §7. Finally, we summarize our findings, limitations, and potential future directions in §8.
2 Background
In this section, we will introduce the foundational concepts that underpin our discussion in the subsequent sections.
2.1 bpftime
kernel-based eBPF operations, particularly uprobes, suffer from significant overhead due to frequent context switches. By moving these operations into user space, bpftime removes the need for multiple context switches, providing up to a 10x performance boost. This approach also improves configurability, reduces security risks associated with kernel-level privileges, and allows for efficient syscall hooking within processes. Furthermore, bpftime[17] supports user-space eBPF Maps in shared memory and remains compatible with existing eBPF development tools such as clang and libbpf, even providing CO-RE support through BTF. Ultimately, bpftime showcases a more streamlined, flexible, and secure runtime for eBPF in user space. Historically, extended Berkeley Packet Filter (eBPF) programs have been largely confined to the kernel space due to their close integration with low-level system operations like networking, tracing, and security enforcement. The uprobe mechanism in eBPF permits instrumentation at user-level function entry or exit points, but when managed by the kernel, it often incurs performance penalties caused by the overhead of switching execution contexts between user space and kernel space.
These overheads stem from the additional steps the operating system must take each time a probe fires, including saving processor states and transferring control to the kernel. Over multiple probes or high-event scenarios, this latency can become pronounced, ultimately throttling system throughput and the speed of data collection. By moving these uprobes and other hooks to user space instead, the bpftime framework significantly reduces these transitions, accelerating tracing operations without sacrificing functionality. This user-space approach also bypasses the need for certain kernel-level permissions, diminishing the kernel's attack surface and lowering barriers for developers and operators who wish to leverage eBPF without full administrative privileges. Moreover, the bpftime system employs binary rewriting to achieve safe and efficient hooking of functions, thus enabling advanced eBPF-based observability for processes without requiring reboots or code recompiles. With support for shared memory eBPF Maps, bpftime extends its capabilities to multi-process scenarios and control-plane interactions, all while remaining compatible with established eBPF toolchains and preserving Compile Once – Run Everywhere (CO-RE) functionality.
2.2 PTX JIT
PTX (Parallel Thread Execution) serves as an intermediate representation for NVIDIA GPUs, offering a device-independent layer for parallel computations, which is faster than NVBit[9, 14] tools. PTX Just-In-Time (JIT), used in[7, 8] compilation allows developers to convert PTX code into GPU-specific machine instructions on the fly, enabling them to adapt and optimize their programs in real-time. This capability extends beyond simple runtime compilation: it facilitates dynamic instrumentation by letting users intercept and modify PTX instructions before they are turned into final machine code (SASS). In doing so, developers can embed profiling counters, memory checks, or custom analytics directly into the GPU kernel with minimal overhead. Because PTX JIT operates at this higher-level IR—rather than at the raw binary level as in frameworks like NVBit—it often delivers superior performance, as it bypasses the complexity of rewriting fully compiled machine instructions. This leads to highly optimized code tailored to the specific GPU architecture, capitalizing on features such as register usage and warp scheduling. Additionally, PTX JIT integrates naturally with existing NVIDIA toolchains (including NVCC and NVRTC), letting users refine or generate specialized kernels without leaving familiar workflows, and removing the need for time-consuming offline recompilation every time a kernel needs to change or be instrumented.
3 Related Work
Meta's AI observability infrastructure[2] and many other tools[1, 3, 4] illustrates a multi-layered approach to monitoring, performance introspection, and fleet-wide optimization for large-scale AI workloads. At the foundational level, Dynolog—a distributed telemetry daemon—collects bare-metal metrics on CPU, GPU, and other specialized ASICs across Meta's large, heterogeneous data center fleet. These low-overhead measurements (e.g., device power, utilization, FLOPs/sec) act as key indicators of efficiency, helping identify whether hardware resources are used effectively. To address device-specific complexities—such as Nvidia GPU's limited hardware counters—Meta combines heuristic estimation (via DCGM) and selective, more precise tracing (via CUPTI). Building atop this telemetry, Meta employs end-to-end profiling tools like PyTorch Profiler, Kineto, and Strobelight/BPF to capture fine-grained performance data. Through Strobelight's integration with BPF, users can attach uprobes to CUDA and PyTorch memory operations without instrumentation, supporting real-time, secure, and low-overhead profiling. This technique helps track GPU memory leaks, bottlenecks, and device-to-host interaction patterns.
Because Meta runs tens of thousands of GPU jobs daily, manual analysis is impractical. To address scale, Meta Performance Profiling/Analysis Platform automates trace collection, stitching, and analysis across multiple hosts and profilers. Its intelligence layer highlights common inefficiencies—such as data starvation, suboptimal kernel usage, or imbalanced workloads—allowing AI developers to optimize code paths or reconfigure hardware usage. Additionally, by aggregating profile data over time, the platform uncovers long-term trends, such as sudden regressions in kernel duration or patterns in resource consumption that suggest deeper tuning opportunities. Finally, fleet-level resource attribution dashboards break down GPU hours or FLOPs usage by model, user, or product group, ensuring that optimization efforts target the largest consumers of compute time. This data can inform priorities between framework-level improvements (e.g., refining PyTorch kernels) and model-specific optimizations (e.g., restructuring embedding tables or adjusting hyperparameters). Collectively, these workflows and tools from Meta's observability stack demonstrate how systematic performance monitoring, automated data analysis, and a layered telemetry architecture can enable large-scale AI system efficiency, aligning closely with related research on kernels, dynamic instrumentation, and just-in-time optimization strategies in data-intensive computing environments.
4 eGPU Design
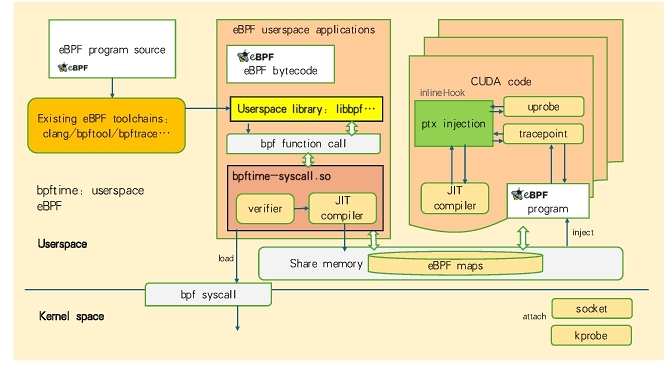
Figure 1 illustrates a unified user-space eBPF environment that integrates with existing eBPF toolchains, CUDA-based components, and the traditional kernel-level bpf syscall. Starting from the top-left, an eBPF program source is compiled using standard utilities such as clang, bpftool, or bpftrace, which emit eBPF bytecode. That bytecode then flows into the user-space eBPF runtime, where it is loaded and possibly instrumented or transformed before execution.
In the center section, there is an eBPF userspace application layer that references a userspace library (for example, libbpf). This library allows interaction with the eBPF function APIs, enabling the application to load or call eBPF functions at run time. A critical component in this layer is bptime-syscall.so, which provides a user-space verifier and JIT compiler. These two elements perform tasks typically associated with kernel-based eBPF, such as verifying the safety of programs and translating bytecode into native instructions, but they do so without requiring kernel-level privileges. The result is that user-space eBPF programs gain flexibility and portability while still benefiting from familiar features like verification and just-in-time compilation.
Below the userspace, there is a bpf syscall interface that can optionally connect this user-space layer to the kernel eBPF subsystem. While the diagram highlights a user-space focused workflow, the presence of bpf syscall ensures that eBPF bytecode or maps can be loaded into the kernel if the system design requires deeper kernel integration or attachment to traditional kernel hooks.
Toward the lower-middle portion, there is a shared memory region used to hold eBPF maps. This shared memory is accessible not only to the user-space components but also to the CUDA code indicated on the right. By registering these maps as pinned or pinned-like memory, both GPU and CPU contexts can observe and update the same data structures, enabling dynamic exchange of events and statistics without the overhead of repeated copying. This arrangement is beneficial for high-throughput instrumentation or data-collection scenarios.
On the right, the figure shows a CUDA environment where user-space eBPF can be extended to generate or inject PTX code. A JIT compiler in this context transforms eBPF bytecode into PTX or other GPU-compatible formats, and then these GPU-extended eBPF features can attach to hooks such as uprobe or tracepoints within the GPU domain. The label “inlineHook” in the diagram indicates the ability to insert instrumentation at specific points inside CUDA code, letting developers trace GPU-side operations in a manner similar to how eBPF operates in the kernel for CPU processes. The eBPF program injected here can interact with the same eBPF maps shared by the rest of the system, ensuring that monitoring, collection, or filtering logic remains consistent across CPU and GPU boundaries.
Another important aspect highlighted by the figure is that the system can accommodate various “attach” targets. While kernel eBPF commonly supports kprobe, socket, and tracepoints, the user-space variant shown here can attach to higher-level events, including application-level function calls or GPU hooks, according to the user's needs. This unified approach establishes a single user-space eBPF solution that can be extended into GPUs while optionally bridging back into the kernel through the bpf syscall, depending on the deployment requirements.
In terms of insights, the design improves the accessibility of eBPF by moving verification and compilation to user space, thus making it easier to develop, debug, and deploy eBPF-based solutions without requiring privileged kernel changes. At the same time, it allows tight integration with GPU resources by leveraging PTX injection, enabling on-device tracing, profiling, or custom event handling. The shared memory approach guarantees low-latency communication between user-space applications, GPU code, and eBPF maps, which is essential for real-time or performance-critical instrumentation. Overall, this architecture provides a flexible environment that extends the traditional power of eBPF into new domains while preserving compatibility with the standard tooling and ecosystem.
5 eGPU Implementation
In this section, we will talk about the eGPU implementation.
5.1 Self Modifying Code
ParallelGPU OS (POS)[8], a novel OS-level system for GPU checkpointing and restoring that runs concurrently with GPU application execution. Its key contributions and innovations include: POS does not require any modifications to the application. It intercepts GPU driver API calls and constructs a runtime kernel Directed Acyclic Graph (DAG) that captures fine-grained semantics—specifically, which GPU buffers are read from or written to during kernel execution. By speculatively extracting buffer access patterns from kernel arguments (with runtime validation to ensure accuracy), POS can emulate features such as “soft copy-on-write”, “soft dirty bit”, and “soft on-demand load”. This approach overcomes the limitations of GPUs (which lack native dirty bits and copy-on-write support) and enables coordinated concurrent checkpointing and restoring. POS overlaps checkpoint/restore operations with normal GPU execution, dramatically reducing downtime. This concurrency is achieved by leveraging the kernel DAG to schedule memory copies and manage dependencies without halting application progress. We leverage the POS for PTX self-modifying code.
5.2 Shared Memory
In our implementation, we use boost::managed_shared_memory to facilitate transparent data exchange between different processes. This shared memory region holds crucial data structures—such as eBPF maps, input batches, or intermediate states—that both the CPU and GPU kernels can access concurrently. By designing this memory with direct GPU compatibility in mind, we reduce the need to marshal data back and forth through costly copy operations. Furthermore, we anticipate the potential of next-generation hardware like Grace Hopper architectures and CXL memory pools, which promise to unify large memory regions with low-latency interconnects. Such advances can seamlessly extend the capacity and performance of managed_shared_memory, allowing kernels to operate over broader data sets without incurring frequent synchronization or replication overhead.
5.3 Synchronization
Given that multiple CPU threads and GPU kernels share data structures, synchronization must be carefully managed to avoid race conditions and ensure memory consistency. We rely on several mechanisms that operate at different levels. On the CPU side, standard lock-based or lock-free data structures (e.g., using std::atomic or Boost interprocess primitives) ensure that host processes do not introduce inconsistent states in shared regions. Within the GPU, we use CUDA atomic operations and device-wide memory fences to serialize updates to global or shared memory. This combined strategy, supported by a well-defined data layout in managed_shared_memory, ensures that asynchronous updates remain visible to all participants. For frequent small-scale synchronization events, we minimize warp-level conflicts by having only a small subset of threads perform atomic operations, whereas the rest of the kernel continues to process data in parallel.
5.4 PTX Generation & Injection
Our system performs eBPF or application-specific code transformations into PTX to enable GPU-side instrumentation and computation. When user-space or eBPF logic requests that certain functions be offloaded or traced on the GPU, our JIT compiler generates specialized PTX snippets. These are then dynamically injected into the running kernel through device-resident hooks. We refer to this technique as “PTX injection,” which allows us to intercept or insert instructions without tearing down the existing kernel context. This approach helps reduce overhead compared to stopping the kernel, recompiling the entire codebase, and relaunching it.
Once injected, the PTX code can interoperate with eBPF maps or other shared memory buffers, granting it direct access to the same data structures used by the CPU side. PTX injection creates a flexible environment for GPU instrumentation, tracepoints, and user-defined logic that can adapt in real time as new workloads arrive or instrumentation needs change. By carefully managing memory barriers and code patching points, we ensure that newly injected PTX interacts cleanly with the previously running kernel components.
In sum, eGPU integrates C/R, shared memory, robust synchronization, and PTX-based offloading to deliver a low-overhead, adaptive GPU computation model. Persistent kernels eliminate repeated launches, shared memory reduces copying costs, synchronization primitives guard against data hazards, and PTX injection enables fine-grained dynamic instrumentation. Looking ahead, improved hardware features in Grace Hopper and CXL memory pools are poised to amplify these benefits, further minimizing overhead and expanding the scope of user-extended GPU workloads.
6 Use Case
6.1 GPU Memory Observer and CXL.mem Simulator
To achieve fine-grained observability of GPU memory behavior, eGPU instruments low-level memory operations—specifically the load (LD) and store (ST) instructions on NVIDIA GPU architectures. These instructions form the core of the GPU's memory access model, and by capturing each LDR and STR operation, our tool provides unprecedented insight into memory bandwidth utilization, access patterns, and contention that prior work could not achieve.
We leverage eBPF-based instrumentation to hook into the GPU kernel events corresponding to LD and ST operations. By placing probes at key functions in the CUDA driver stack, we capture metadata such as the memory address, access size, and timestamp for each operation. This detailed logging enables the computation of real-time metrics such as memory bandwidth. For example, the bandwidth over a time window Twindow is given by:
(1)
Beyond observation, we simulate a second tier of memory using CXL.mem by introducing dynamic latency insertion into the observed memory operations. The objective is to emulate the behavior of CXL-attached memory, which typically exhibits higher latency and lower bandwidth compared to local GPU memory. In our model, the effective access latency for a memory operation is expressed as:
(2)
This dynamic delay model enables the emulation of a two-tier memory system where data may reside in either fast local memory or slower CXL-attached memory. Our experiments compare the performance of GPU kernels with and without the CXL.mem simulation enabled. Memory-bound kernels, in particular, demonstrate a significant increase in effective latency—up to 2–3 × —when subjected to the additional delays, thus highlighting the trade-offs between increased memory capacity and reduced access speed. These findings align with prior work on CXL.mem systems [15].
6.2 LLM CPU-GPU Collaborative Caching
Large Language Models (LLMs) can easily max out GPU memory, prompting a collaborative CPU–GPU caching scheme to handle their large state. The core challenge is deciding which data should stay in faster GPU memory and which should reside in CPU memory, ready to be transferred when needed. An effective cache not only evicts data intelligently but also prefetches data to minimize transfers. eGPU plays a key role here by giving a detailed look at how the cache behaves, along with the underlying memory access patterns that span both CPU and GPU. By logging events like page faults, DMA copy calls, and unified memory migrations, our tool reveals which model parameters and activations are accessed frequently and which remain idle. Engineers can then optimize cache policies, for example, making sure the most frequently accessed weights remain on the GPU, while less active data stays on the CPU side until required.
Eviction policies are essential for managing finite GPU memory. Least Recently Used (LRU) is a popular choice: when the cache is full, it evicts data that has not been accessed for the longest time. Many AI frameworks default to LRU for GPU caches, offloading the least-recently-used layers or “expert networks” to CPU memory first. Another option, Least Frequently Used (LFU), retains items with the highest access counts. LFU can outperform LRU in scenarios where a small subset of weights dominates usage. It's also common to combine dynamic policies like LRU or LFU with static caching, where certain data is pinned in GPU memory based on domain insights—perhaps the most crucial layers in a model. A hybrid approach might evict the oldest conversation context in a multi-turn dialogue, while applying LRU across all session data. By monitoring cache hit rates and transfer volumes, eGPU helps verify that these policies are working well.
Besides eviction, shared memory arrangements between the CPU and GPU have a major impact on performance. NVIDIA's Unified Memory creates a single address space spanning both CPU and GPU, automatically migrating pages in response to faults. While Unified Memory simplifies development, its performance depends on how often pages get shuttled back and forth. eGPU makes it easy to spot repeated faults or unnecessary transfers, suggesting when manual methods (like using pinned host memory) might be better. Pinned memory enables faster DMA transfers, and techniques such as Direct Host Access allow GPU kernels to read data straight from CPU memory over PCIe. These optimizations often overlap data movement with computation to reduce latency.
Further improvements involve zero-copy buffers and stream-ordered prefetching. Zero-copy buffers let GPU threads directly access host memory (no redundant copying), while prefetching sends data to the GPU before it's needed. Real-world applications, such as model offloading in systems like DeepSpeed Zero-Inference or caching key/value vectors for transformer layers, can reap significant benefits with a well-structured collaborative cache. By providing visibility into how each caching method performs, eGPU speeds up development cycles and lowers inference times for large-scale LLMs.
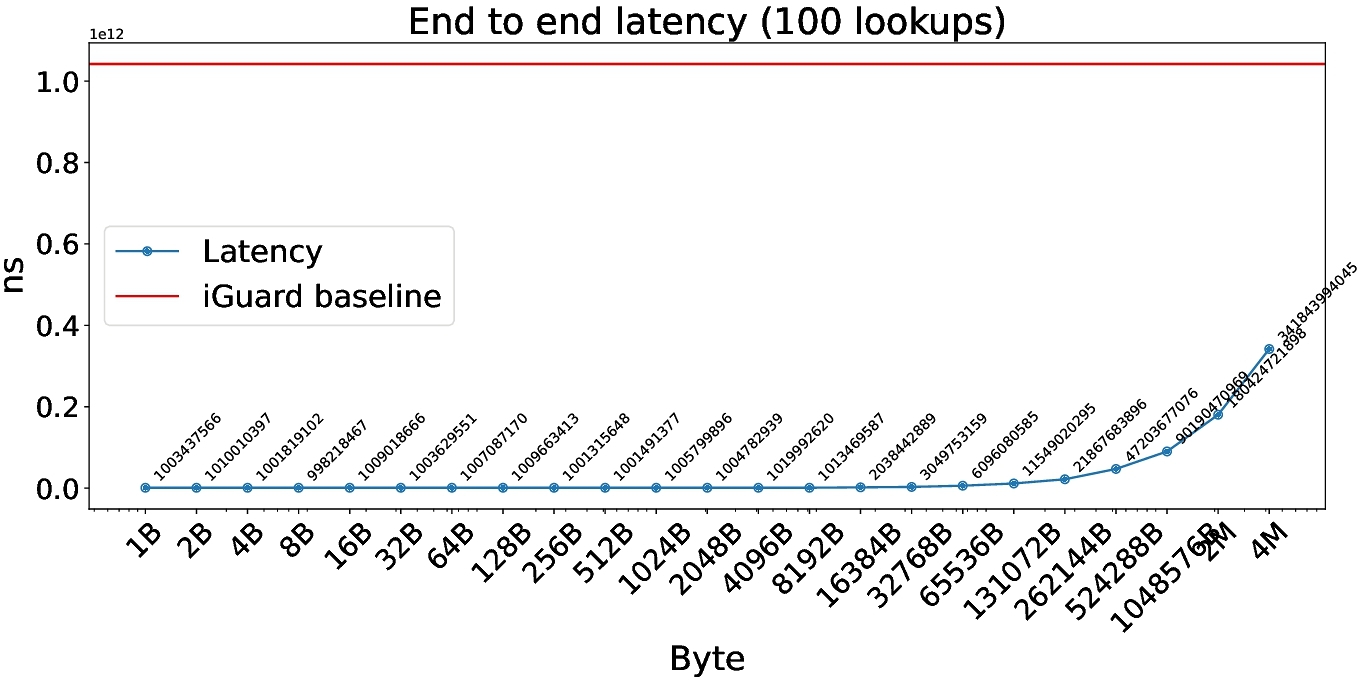
Figure 2 presents a micro-benchmark comparison with [9], illustrating the effectiveness of our memory caching approach. The baseline we compare against, called gpumemtrace, instruments the mov instruction and reroutes its logic to transfer memory to the host. However, as the figure shows, NVBit's instrumentation overhead becomes a bottleneck, especially as the hashmap's value size grows beyond 32KB. Past that point, data can't fit in the eBPF stack and must reside in a global map, impacting performance.
7 Evaluation
We evaluated eGPU on a dual-socket Intel Xeon E5-2697-v2 processor (48 cores, 2.7 GHz, 30 MB LLC) equipped with 256 GB DDR3 RAM and an NVIDIA P40 GPU.
7.1 Micro-benchmark Performance
We initially assessed the instrumentation overhead introduced by eGPU through a latency-focused micro-benchmark. Specifically, we measured GPU memory access latency while instrumenting load and store operations, comparing eGPU with NVBit-based instrumentation (gpumemtrace [14]). Both systems were evaluated using a set of operations with varying memory access sizes.
Our micro-benchmark results, as depicted in Figure 2, demonstrate that eGPU introduces significantly lower instrumentation overhead compared to NVBit-based approaches. While NVBit exhibited substantial latency increases due to heavy instrumentation overhead, eGPU maintained relatively stable and low latencies across smaller memory access sizes (below 128 KB). Beyond 128 KB, latency moderately increased, while still lower than the baseline.
These results validate our key design decision: dynamically injecting lightweight PTX instrumentation at runtime significantly reduces overhead compared to traditional GPU instrumentation methods.
7.2 Discussion and Limitations
While our micro-benchmark clearly demonstrates eGPU ’s low instrumentation overhead, we acknowledge that our current evaluation scope is limited. Specifically, we have not yet conducted extensive end-to-end performance evaluations on complex, real-world workloads such as large-scale machine learning models or HPC simulations. Furthermore, overhead associated with PTX injection and JIT compilation at kernel initialization, although modest in our tests, may be more pronounced in workloads involving numerous small, short-lived kernels.
Future evaluations will address these limitations by assessing eGPU on realistic GPU workloads, including detailed comparisons of overall runtime, throughput, and system resource utilization. Additionally, further optimizations to reduce PTX compilation overhead and enhanced synchronization methods will be investigated to ensure broader applicability and efficiency in diverse production scenarios.
8 Conclusion
Our early tests show that eGPU helps cut overhead by avoiding frequent kernel launches and supports faster data exchange through shared memory. It can also handle dynamic code injection without disrupting active kernels. By keeping the GPU occupied with long-running kernels, we streamline computational pipelines and balance workloads more effectively, which is particularly helpful for streaming or irregular tasks.
We rely on boost::managed_shared_memory so the CPU and GPU can work on a shared data space. This lowers the cost of moving data back and forth and makes it easier to handle concurrency. Meanwhile, injecting PTX at runtime lets us adapt or instrument GPU code on the fly without having to restart everything, which is a big plus for any application that needs real-time flexibility.
Of course, there are still some sticking points. JIT compilation introduces its own overhead, and managing smaller kernels under a checkpoint-restore setup can be tricky. We think performance can be pushed further by fine-tuning how many streaming multiprocessors each kernel uses or by leveraging hardware-accelerated contexts on newer GPU architectures. Going forward, we're looking at broader device contexts and memory-sharing methods—especially on upcoming Grace Hopper GPUs and with CXL memory pools—to expand how and where this approach can be applied. Overall, our results so far show that tightening synchronization, and adding more flexible PTX-based instrumentation could lay the groundwork for a responsive, high-throughput framework tailored to GPU-driven workloads.
Acknowledgments
The authors wish to acknowledge the use of Claude in the writing of this paper. This tool was used to assist with improving the language in the paper and providing translations on implementations section.
References
- 2025. Auto-instrumentation for GPU performance using eBPF. https://fosdem.org/2025/schedule/event/fosdem-2025-5162-auto-instrumentation-for-gpu-performance-using-ebpf/
- Valentin Andrei. 2024. System@Scale: AI Observability. https://atscaleconference.com/systemscale-ai-observability/. Retrieved January 2024.
- Josie E Rodriguez Condia, Juan-David Guerrero-Balaguera, Fernando F Dos Santos, Matteo Sonza Reorda, and Paolo Rech. 2022. A multi-level approach to evaluate the impact of GPU permanent faults on CNN's reliability. In 2022 IEEE International Test Conference (ITC). IEEE, 278–287.
- Bengisu Elis, David Boehme, Olga Pearce, and Martin Schulz. 2024. A Mechanism to Generate Interception Based Tools for HPC Libraries. In European Conference on Parallel Processing. Springer, 107–120.
- Yoann Ghigoff, Julien Sopena, Kahina Lazri, Antoine Blin, and Gilles Muller. 2021. { BMC} : Accelerating memcached using safe in-kernel caching and pre-stack processing. In 18th USENIX Symposium on Networked Systems Design and Implementation (NSDI 21). 487–501.
- Yue Guan, Yuxian Qiu, Jingwen Leng, Fan Yang, Shuo Yu, Yunxin Liu, Yu Feng, Yuhao Zhu, Lidong Zhou, Yun Liang, et al. 2024. Amanda: Unified Instrumentation Framework for Deep Neural Networks. In Proceedings of the 29th ACM International Conference on Architectural Support for Programming Languages and Operating Systems, Volume 1. 1–18.
- Mingcong Han, Weihang Shen, Guanwen Peng, Rong Chen, and Haibo Chen. 2024. Microsecond-scale Dynamic Validation of Idempotency for GPU Kernels. arXiv preprint arXiv:2410.23661 (2024).
- Zhuobin Huang, Xingda Wei, Yingyi Hao, Rong Chen, Mingcong Han, Jinyu Gu, and Haibo Chen. 2024. PARALLELGPUOS: A Concurrent OS-level GPU Checkpoint and Restore System using Validated Speculation. arXiv preprint arXiv:2405.12079 (2024).
- Aditya K Kamath and Arkaprava Basu. 2021. IGUARD: In-GPU advanced race detection. In Proceedings of the ACM SIGOPS 28th Symposium on Operating Systems Principles. 49–65.
- Pouya Kousha, Bharath Ramesh, Kaushik Kandadi Suresh, Ching-Hsiang Chu, Arpan Jain, Nick Sarkauskas, Hari Subramoni, and Dhabaleswar K Panda. 2019. Designing a profiling and visualization tool for scalable and in-depth analysis of high-performance GPU clusters. In 2019 IEEE 26th International Conference on High Performance Computing, Data, and Analytics (HiPC). IEEE, 93–102.
- NVIDIA. 2025. CUDA Profiling Tools Interface (CUPTI). https://developer.nvidia.com/cupti Accessed: 2025-03-02.
- David Pankratz, Tyler Nowicki, Ahmed Eltantawy, and José Nelson Amaral. 2021. Vulkan Vision: Ray tracing workload characterization using automatic graphics instrumentation. In 2021 IEEE/ACM International Symposium on Code Generation and Optimization (CGO). IEEE, 137–149.
- Du Shen, Shuaiwen Leon Song, Ang Li, and Xu Liu. 2018. Cudaadvisor: Llvm-based runtime profiling for modern gpus. In Proceedings of the 2018 International Symposium on Code Generation and Optimization. 214–227.
- Oreste Villa, Mark Stephenson, David Nellans, and Stephen W Keckler. 2019. Nvbit: A dynamic binary instrumentation framework for nvidia gpus. In Proceedings of the 52nd Annual IEEE/ACM International Symposium on Microarchitecture. 372–383.
- Yiwei Yang, Pooneh Safayenikoo, Jiacheng Ma, Tanvir Ahmed Khan, and Andrew Quinn. 2023. CXLMemSim: A pure software simulated CXL. mem for performance characterization. arXiv preprint arXiv:2303.06153 (2023).
- Zhe Yang, Youyou Lu, Xiaojian Liao, Youmin Chen, Junru Li, Siyu He, and Jiwu Shu. 2023. {λ -IO} : A Unified { IO} Stack for Computational Storage. In 21st USENIX Conference on File and Storage Technologies (FAST 23). 347–362.
- Yusheng Zheng, Tong Yu, Yiwei Yang, Yanpeng Hu, XiaoZheng Lai, and Andrew Quinn. 2023. bpftime: userspace eBPF Runtime for Uprobe, Syscall and Kernel-User Interactions. arXiv preprint arXiv:2311.07923 (2023).
- Yuhong Zhong, Haoyu Li, Yu Jian Wu, Ioannis Zarkadas, Jeffrey Tao, Evan Mesterhazy, Michael Makris, Junfeng Yang, Amy Tai, Ryan Stutsman, et al. 2022. { XRP} :{ In-Kernel} Storage Functions with { EBPF}. In 16th USENIX Symposium on Operating Systems Design and Implementation (OSDI 22). 375–393.
- Keren Zhou, Laksono Adhianto, Jonathon Anderson, Aaron Cherian, Dejan Grubisic, Mark Krentel, Yumeng Liu, Xiaozhu Meng, and John Mellor-Crummey. 2021. Measurement and analysis of GPU-accelerated applications with HPCToolkit. Parallel Comput. 108 (2021), 102837.

This work is licensed under a Creative Commons Attribution 4.0 International License.
HCDS '25, Rotterdam, Netherlands
© 2025 Copyright held by the owner/author(s).
ACM ISBN 979-8-4007-1470-2/25/03.
DOI: https://doi.org/10.1145/3723851.3726984