Evaluating Ad Creative and Web Context Alignment with Attention Measurement
DOI: https://doi.org/10.1145/3629264.3629265
ICCDA 2023: 2023 The 7th International Conference on Computing and Data Analysis (ICCDA), Guiyang, China, September 2023
Contextual targeting is a common strategy that places marketing messages in media locations that are aligned with a target audience. The challenge of contextual targeting is knowing the ideal schema and the set of categories that provide the right audience. Refinement of the contextual targeting process has been limited by the use of metrics that are either rapid but unreliable (click through rates), or reliable but slow, expensive and inaccessible in real-time (conversions or brand awareness).
In this study we evaluate the use of attention measurement as a technique for understanding the alignment between advertising creatives and media contexts. We perform the analysis using a large scale dataset of impressions categorised using the iAB V2.0 taxonomy. We evaluate the alignment by looking for consistency across time in the attention a given creative attracts over the levels of the categorisation hierarchy.
Our research is the largest known study of the relationship between advertising creative, media context and consumer attention. We provide strong empirical evidence that consumer attention is related to an alignment between the creative execution and topics of media context. Furthermore, we show that this relationship transcends any specific publication by providing reliable indications of attention on new website domains.
ACM Reference Format:
John Hawkins and Graham Burton. 2023. Evaluating Ad Creative and Web Context Alignment with Attention Measurement. In 2023 The 7th International Conference on Computing and Data Analysis (ICCDA) (ICCDA 2023), September 15--17, 2023, Guiyang, China. ACM, New York, NY, USA 6 Pages. https://doi.org/10.1145/3629264.3629265
1 INTRODUCTION
Contextual targeting allows advertisers to reach people with known interests, rendered explicit by the choice to consume media with content about a specific topic. These contexts are thereby used to infer potential purchase intentions, due to the association between interests and products. Context is increasingly seen as a critical factor in creating and defining brand engagement [23].
Context is also often used as an indirect method of reaching people that belong to certain audiences or groups on the basis that people's interests and demographics are aligned [21]. A strategy that may be more effective given that targeting on the basis of gender alone may not drive better results for many campaigns [9]. The underlying assumptions about the relationships between demographics, content and intentions are supported by investigations into the social media behaviour of different demographic groups [25]. Multiple studies have looked at the effect of media context on advertising outcomes. A recent meta-analysis found significant effects for multiple dimensions of media context on advertising recall [14]. However, studies that look at the congruence between the topic context of a page and the content of an ad have found some counterintuitive results. For example, brand recall can be associated with ads appearing within irrelevant contexts, potentially due to an ability to stand out from a suite of relevant ads [12].
The difficulty of implementing effective contextual targeting comes down to three key issues. You will need to determine an ideal contextual hierarchy or categorisation scheme that can be applied uniformly across all media. You need to identify which components of that categorisation scheme are appropriate for your brand or specific campaign. Finally, you need to balance the contextual targeting against other goals like reach and frequency. Advertisers generally must expand targeting across high-level categories in order to fulfill requirements as highly specific contexts are both expensive and rare.
In this work we experiment with the use of gaze duration as a measurement of visual attention to determine the relative performance of categories within the iAB V2.0 Contextual Hierarchy [4]. We undertake this to understand the uniformity of the right context for a given brand, and the reliability of performance across the hierarchy and across time. The goal is to determine strategies by which contextual targeting can be refined for advertising outcomes.
Eye tracking studies are widely used as a method of measuring overt attention to visual stimuli and have been applied to study the extent to which people look at, and remember, advertising [8]. The technology has also allowed the study of many factors that contribute to effective marketing, including the impact of images of faces [3], the use of animation [7, 15], the relationship with social media posts [1], and emotional responses to visual stimuli in different physical spaces [11].
Multiple investigations have identifed that attention time on advertising provides a real-time metric that is correlated with important downstream impacts like brand recall [15], consideration and purchase intent [2, 18]. Importantly, even though low attention can drive brand outcomes, multiple studies have demonstrated that greater attention through direct fixation has a greater impact on marketing outcomes, including consideration, choice [20] and short term advertising strength [16]. The pervasive evidence of the role of visual attention in the success of advertising has led to increasing focus on Attention Based Marketing research [17].
Contextual relevance is a method of aligning the message in advertising with the editorial content that it is presented with [24]. This is not simply a matter of being about the same topic, as consumers have been shown to pay more attention to advertising that is relevant to their current task (i.e. what they are looking for, or why they are reading) than simply advertising that is contextually aligned [19]. This is coherent with observations in the psychological literature that overt visual attention is influenced by motivations and personality traits of individuals [10]. Thus, the role of contextual targeting may be to bring top-down attention selection to advertising that would otherwise garner attention in a bottom-up manner [5].
We draw on two observations to motivate the current work. Firstly, advertisers are aware that alignment between a campaign creative and media context can drive outcomes. Secondly, they require methods for detecting when that alignment is functioning and when it is not. The thesis of this research is that large scale real-time measurement of ad attention can determine if an ad is aligned with a specific context, and thereby provide a tool for fine tuning contextual targeting strategies for advertiser outcomes. Conversely, it opens the door to using contextual targeting as a method for advertisers to combat diminishing attention on advertising [17, 22].
2 METHODOLOGY
In this research we investigate the efficacy of contextual targeting strategies for obtaining improvements in the mean attention time paid to digital advertising. The essential research question is whether the attention an ad attracts within a given media context provides information about its future performance. The null model assumes that context is not relevant and any contextual variation should be subject to a regression to the mean. In other words, the control hypothesis is that the mean attention paid to a specific creative should be a better predictor of future attention, than the attention that was paid within a specific context.
For the purposes of obtaining large scale measurements of attention time on display advertising we utilise a machine learning system trained on data collected from eye-tracking studies. The attention model provides an impression level estimate of attention time that aggregates up into low error measurements of mean attention time over groups of inventory.
2.1 Attention Measurement
We developed an attention measurement system that predicts attention time from user behavioural signals. The training data is collected from eye tracking panels in which subjects read media in self-directed sessions while eye tracking data is collected using a gaze fixation model trained on facial images [13].
As the eye tracking data is collected, we track a large number of other signals about the user experience including environmental signals like the page structure, and behavioural data like scroll events and the position of the advertising in the viewport.
| Metric | Banner | MREC |
|---|---|---|
| Aggregate MAE | 35 ms | 48 ms |
| 95% Upper Bound | 102 ms | 83 ms |
| 95% Lower Bound | -94 ms | -158 ms |
The signals collected along with the eye tracking data allow us to build and deploy an attention measurment model that can predict the attention time paid to specific ad units within a page. The attention model can be applied to all digital inventory that accepts the javascript tag.
Our model evaluation process focuses on the accuracy of measuring mean attention time for a specific ad format, over varying samples of inventory. To generate the performance statistics we run bootstrap sampling of the test data to look at the expected error when predicting the mean attention time over impressions for a specific ad format. Each metric is calculated by taking 500 impression samples 10000 times, and using the resulting distribution of mean error. The mean attention time measurement performance is summarised in Table 1. We see that the aggregate mean absolute error (MAE) for both formats is very low at 35ms and 48ms for banners and MRECs respectively. Furthermore, the $95\%$ confidence intervals for these values is constrained to be one the order of 100ms either side of the true value. We apply this attention measurement model across large scale digitial inventory to collect a data set of attention time paid to a range of advertisments over time. We use these attention measured impressions to investigate the impact of contextual categories of media on the attention paid to advertising.
2.2 Data
The data used in this study was collected from a wide range of advertisers running broadly targeted campaigns between February and March 2022. It includes brands in the automotive, retail, travel and health services verticals. The data is broken into two one week time periods, the raw data was filtered such that we had impressions for every creative in both periods of time. This was a requirement of our approach so that we can study the continuity of the relationships between creative, context and attention across time.
In the analysis that follows we apply different levels of aggregation to the log level impression data, so that we calculate the mean attention time for a given creative in the specific context. Within each experiment we will filter the aggregated data to ensure that every sample point is derived from a least 50 impressions. This is done to ensure robust estimates of mean attention within a given category. Summary statistics for the dataset are shown in Table 2. Note, that due to the restriction outlined above, not every sample point will be in all experiemnts.
| Metric | Feb 18 - 24 | Feb 25 - March 03 |
|---|---|---|
| Impressions | 16,895,661 | 10,488,816 |
| URLS | 26,006 | 27,855 |
| Domains | 2,263 | 2,585 |
| Creatives | 683 | 683 |
| Advertisers | 59 | 59 |
2.3 Contextual Categorisation
In order to derive contextual categories for each record in our dataset, we applied the Verity API (GumGum) to the URLs. We converted the results of the API response into a variety of features that describe the contextual categories derived from the iAB V2.0 hierarchy [4].
We identified the iAB category for which Verity had returned the highest score and converted that category into a set of labels for classification across the four Tiers of iAB V2.0. In instances where the classified category is from a higher position in the hierarchy, then the lower level tiers are given the deepest available category. For example, if we have a URL that is classified as iAB V2 category "Business and Finance" (a Tier 1 category) then Tiers 2, 3 and 4 will all contain the same value.
Alternatively, if we have another URL that is classified as "Marketing and Advertising" (a Tier 3 category that sites below "Business and Finance"), then the hierarchical labels would be assigned as follows:
- Tier 1: ["Business and Finance"]
- Tier 2: ["Business"]
- Tier 3: ["Marketing and Advertising"]
- Tier 4: [ Marketing and Advertising ]
In the above instance the deepest initial categorisation is "Marketing and Advertising" coming from Tier 3. This category is then inherited to any remaining tiers (as indicated by the italics at Tier 4 in this example). The idea of this scheme is that every page will always be assigned a categorisation across all four levels in the hierarchy, but sometimes the category at a given Tier will not be any more specific than the parent category. This approach ensures that when we make comparisons of the effectiveness of targeting at a certain Tier we are always able to include all data points. This approach is both more robust, in terms of the comparability of results, and pragmatic in the sense that when using these categories for campaign targeting a decision would always need to be made about whether a given URL satisfies the targeting requirements at a specific Tier. Additionally, this approach ensures that when we look at a deeper level in the hierarchy we will have at least as many distinct categories as the parent Tier.
2.4 Metrics
The focus of our analysis is to determine whether the performance of each creative, in a set of contexts, remains consistent across the two time periods. Within each time period we aggregate the measured attention time over the impression level data to obtain multiple metrics for the reliability of attention time within a given context.
The attention metrics are calculated for a set of impressions Ip in a time period p. We first define a baseline for a creative c in period p as: ${}^c\mathcal {A}_p$. This is defined in equation 1.
(1)
Where the function A(i) returns the attention measured on impression i and 1c(i) is an indicator function that tests whether impression i belongs to creative c, as shown in equation 2.
(2)
Similarly, we denote the baseline attention achieved by ads on pages classified as belonging to category t in period p as: ${}_t\mathcal {A}_p$. Defined in equation 3. Note, we use the notation t for categories as they are equivalent to topics, and this distinguishes them from the creatives.
(3)
Where 1t(i) is an indicator function that tests whether impression i was shown on a page classified as category t, as show in in equation 4.
(4)
We denote the mean attention performance for a creative c, on media of category t within period p as ${}^c_t\mathcal {A}_p$. This is defined as shown in Equation 5.
(5)
Where we simply apply a indicator function $\mathbf {1}^c_t(i)$ that is a composite of Equations 2 and 4 to filter for inventory that belongs both to creative c and category t. These equations should illustrate that we make our evaluations by looking at the expected attention time across difference slices of the inventory.
2.5 Analysis
Our analysis proceeds by ranking all topics that each creative c was exposed to according to the value of ${}^c_t\mathcal {A}_1$. We then look at the same creatives in period 2 and evaluate ${}^c_t\mathcal {A}_2$ for the top three ranking categories from the first period, as well as the bottom ranking category. This approach necessitates that each creative be exposed to a minimum of these same 4 categories in both periods. In the results that will follow we report the number of records in each trial, reflecting the number of aggregated records that fulfills these requirements.
Once we have the datasets in each period that meet these requirements we use multiple metrics to evaluate the impact of the contextual categories. Our primary metric is the percentage of instances in which the category specific performance ${}^c_t\mathcal {A}_2$ is above the creative's baseline expected performance ${}^c\mathcal {A}_1$. This is shown as % Over (the baseline) in the tables of results.
In addition we look at the mean difference between ${}^c_t\mathcal {A}_2$ and ${}^c\mathcal {A}_1$ over all creatives in the experiment. This is denoted \boldmath $\bar{\Delta }$ (or mean delta) in the tables and defined in Equation 6
(6)
The mean delta illustrates an expectation of the difference between attention time performance and the creative baseline, using a specific contextual targeting strategy. In addition, we show the difference expressed as a mean percentage (against the baseline) in the column $\mathbf {\bar{\Delta }\%}$. This can be interpreted as the expected percentage increase/decrease relative to the creative's baseline attention, when using that contextual targeting strategy.
3 RESULTS
We conduct two variations of the experiment, each one looking at different criteria for evaluating performance on new inventory. These are referred to as the No URL Repeats and the No Domain Repeats experiments.
3.1 No URL Repeats
In Table 3 we see the results of looking at performance on novel URLs for a creative, where the iAB V2.0 contextual categories of those URLs were present in either the top three or last ranking position in the initial period.
| Level | Count | Rank | % Over | $\bar{\Delta }$ | $\bar{\Delta }\%$ |
|---|---|---|---|---|---|
| Tier1 | 206 | 1st | 100.0% | 4.5 | 93.2% |
| 2nd | 96.6% | 2.6 | 49.8% | ||
| 3rd | 80.6% | 1.4 | 28.7% | ||
| Last | 0.0% | -3.7 | -53.3% | ||
| Tier2 | 210 | 1st | 99.5% | 6.3 | 132.0% |
| 2nd | 95.7% | 3.7 | 68.6% | ||
| 3rd | 80.0% | 2.4 | 41.2% | ||
| Last | 0.0% | -4.1 | -59.2% | ||
| Tier3 | 210 | 1st | 99.5% | 6.4 | 135.7% |
| 2nd | 95.7% | 3.8 | 69.5% | ||
| 3rd | 79.5% | 2.4 | 41.8% | ||
| Last | 0.0% | -4.1 | -59.2% | ||
| Tier4 | 210 | 1st | 99.5% | 6.4 | 135.7% |
| 2nd | 95.7% | 3.8 | 69.5% | ||
| 3rd | 79.5% | 2.4 | 41.8% | ||
| Last | 0.0% | -4.1 | -59.2% |
We see that, in general, targeting pages using categories deeper into the hierarchy improves the expected increase in attention through contextual targeting. However, the effect appears to plateau at Tier3, likely due to the small proportion of inventory that is uniquely classified at a Tier 4 level.
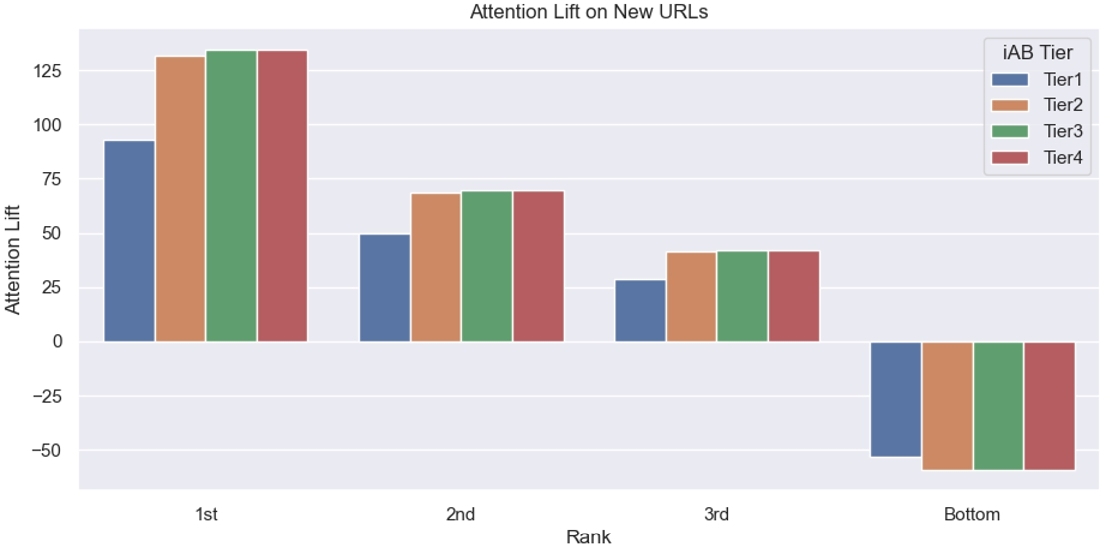
We show the change in attention lift across the dimensions of iAB Tiers and category ranking in Figure 1. This figure demonstrates the increased performance with the specificity of the iAB Tiers and the reduction in performance with the movement down category ranks.
3.2 No Domain Repeats
We repeat the analysis restricting ourselves to impressions in the second period that involve URLS for which the domain was not present in the URLs for the first period. The results are shown in Table 4. We note that the number of records has dropped by more than half in this experiment, due to the difficulty of finding domains that were not present in the first period.
| Level | Count | Rank | % Over | $\bar{\Delta }$ | $\bar{\Delta }\%$ |
|---|---|---|---|---|---|
| Tier1 | 86 | 1st | 98.8% | 5.2 | 144.3% |
| 2nd | 83.7% | 2.3 | 58.8% | ||
| 3rd | 60.5% | 0.4 | 26.9% | ||
| Last | 0.0% | -4.1 | -64.5% | ||
| Tier2 | 83 | 1st | 96.4% | 6.4 | 159.1% |
| 2nd | 84.3% | 2.6 | 71.0% | ||
| 3rd | 59.0% | 0.7 | 35.8% | ||
| Last | 0.0% | -4.5 | -70.0% | ||
| Tier3 | 82 | 1st | 96.3% | 6.5 | 161.3% |
| 2nd | 84.2% | 2.7 | 71.2% | ||
| 3rd | 56.1% | 0.6 | 34.7% | ||
| Last | 0.0% | -4.6 | -69.9% | ||
| Tier4 | 82 | 1st | 96.3% | 6.5 | 161.3% |
| 2nd | 84.2% | 2.7 | 71.6% | ||
| 3rd | 56.1% | 0.6 | 34.7% | ||
| Last | 0.0% | -4.6 | -69.9% |
We show the change in attention lift across the dimensions of iAB Tiers and category ranking in Figure 2. This figure demonstrates that in the no domain repeat experiment we get a very similar overall pattern to the previous experiment. The primary difference being a higher expected lift at the rank one position, and a faster drop off in expected lift as we move down the ranks.
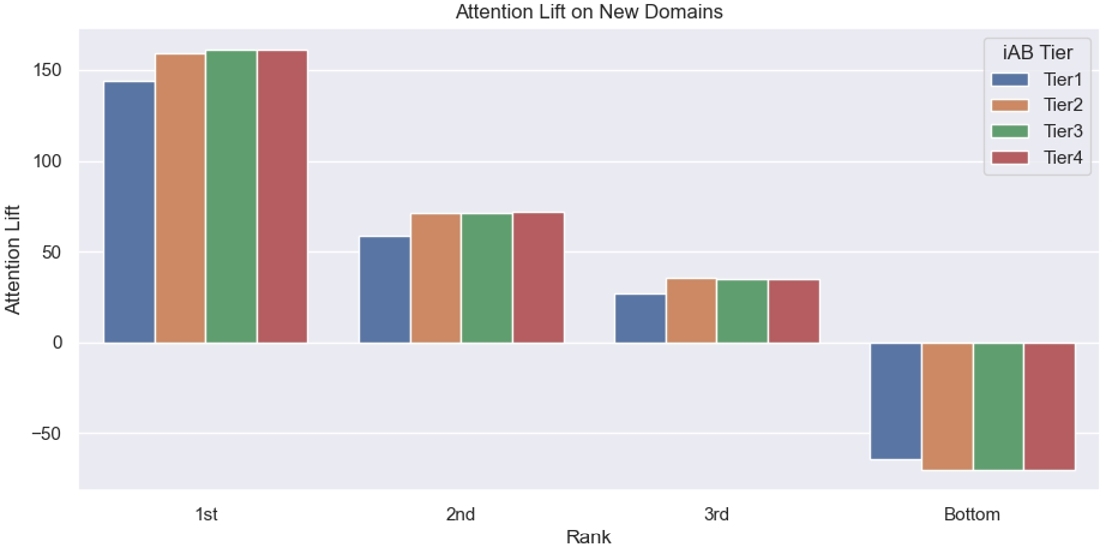
The restriction to unique domains in the second period has lifted the expected improvement of targeting the top performing category (Tier 3) from 135only occurs with the category in ranking position one. For the other ranking positions the results are mixed, even though the percentage amount is sometimes higher, the absolute amount can be lower, due to the fact that the baseline is calculated on the impressions that qualify for inclusion.
These result seems counterintuitive at first glance. Our current hypothesis about why this is the case is that it relates to the specificity of the content on a given domain. The no domain repeats study is biased towards data on less common domains. These domains may have a tendency to be more subject specific, i.e less tendency for discussion of multiple topics.
Additionally, we note that the percentage of instances where the category targeting delivers an improvement over the baseline drops when we look at unique domains. This drop is approximately 3the 3rd ranked category it has dropped from 80targeting new domains with the 3rd ranked category offers a marginally better than random chance of delivering improved attention.
3.3 Significance Tests
We estimated p-values for the significance of the proportion of URLs within a given category that outperform the baseline. We did this using a binomial distribution, under the null model assumption that the relationship between the attention on a URL and its contextual category is random. Hence, the p-value can be estimated as the probability of obtaining the observed number of successful improvements over the baseline as samples from a binomial with a probability of success equal to 0.5.
The computed p-values were extremely small, starting at 10− 62 for first rank of Tier 1 in the No URL Repeats experiment, 10− 24 for the No Domain Repeats experiment. The p-values increase gradually as we move down the ranking of the categories or at deeper levels in the iAB hierarchy, but they always remain below a significance level of 0.05.
A more stringent analysis would apply a Bonferroni correction to account for the multiple hypothesis tests in these tables of data. Even with this correction, the vast majority of results are many orders of magnitude below the significance threshold. However, under this criteria we would reject the third ranking category within the No Domain Repeats experiments. However, as the observed data is overwhelmingly statistically significant, and these values are consistent with the hypothesis being true, but suffering from a diminishing effect size, and reduced sample sizes, we included the values for the third ranking categories in the table.
4 CONCLUSION
The pattern we observe is consistent between the two experiments. Regardless of how novel the inventory is, there is a tendency for media sharing the top contextual categories from the initial period to consistently outperform the baseline attention. This pattern is strongest with the number one category, and then recedes as we progress down the ranking of categories from the first period.
Similarly, the bottom performing category from the first period consistently under performs the baseline in the subsequent period, regardless of whether you are looking at new URLs on existing domains, or entirely new domains. These results strongly suggest that the topics discussed on pages in which an ad appears interact with ad creatives in a way that enables prediction of ad attention.
As we move deeper into the hierarchy from Tier 1 down to Tier 4 we see that the average size of the improvement increases, but this effect appears to plateau at Tier 3. We note that this improvement would often be countered by reduced inventory volumes, suggesting that application of these results will require weighting the gains against potential reach.
When we look at inventory on novel domains we see that there is a further small drop in the proportion of instances where the category continues to deliver improved results. This is countered by an improvement in the gain for the top performing category, suggesting that a reasonable and risk efficient strategy for finding new inventory is to target multiple top ranking categories on known websites, but just the top ranking category on novel websites.
Overall, these results provide strong evidence that attention measurement provides a signal as to whether a given contextual targeting strategy is aligned with an advertising creative. Performance, in terms of attention garnered, in an initial period is predictive of attention in a future period even when the specific media changes. The reliability of attention on new URLs or domains within the same contextual category suggests that the iAB hierarchy provides insight into factors that align advertising creatives with consumer psychology beyond the specifics of a particular media platform.
REFERENCES
- Ana Barreto. 2013. Do users look at banner ads on Facebook?Journal of Research in Interactive Marketing 7 (05 2013). https://doi.org/10.1108/JRIM-Mar-2012-0013
- Dentsu. 2019. The Attention Economy Exploring the opportunity for a new advertising currency. https://www.dentsu.com/attention-economy Accessed: 2022-07-23.
- Soussan Djamasbi, Marisa Siegel, Thomas Tullis, and Rui Dai. 2010. Efficiency, Trust, and Visual Appeal: Usability Testing through Eye Tracking. In In System Sciences (HICSS), 2010 43rd Hawaii International Conference. 1 – 10. https://doi.org/10.1109/HICSS.2010.171
- Kevi Flood and Noel Agnew. 2017. IAB TECH LAB ANNOUNCES FINAL CONTENT TAXONOMY V2 READY FOR ADOPTION. https://iabtechlab.com/blog/iab-tech-lab-announces-final-content-taxonomy-v2-ready-for-adoption/
- Adam Greenberg. 2013. The Role of Visual Attention In Internet Advertising Eleven Questions and a Score of Answers. Journal of Advertising Research 52 (01 2013), 400. https://doi.org/10.2501/JAR-52-4-400-404
- GumGum. 2020. Verity Documentation Center. https://gumgum.jira.com/wiki/spaces/VDC Accessed: 2022-03-28.
- Kai-Christoph Hamborg, M. Bruns, Frank Ollermann, and Kai Kaspar. 2012. The effect of banner animation on fixation behavior and recall performance in search tasks. Computers in Human Behavior 28 (03 2012), 576–582. https://doi.org/10.1016/j.chb.2011.11.003
- Guillaume Hervet, Katherine Guérard, Sébastien Tremblay, and Mohamed Chtourou. 2011. Is Banner Blindness Genuine? Eye Tracking Internet Text Advertising. Applied Cognitive Psychology 25 (09 2011), 708 – 716. https://doi.org/10.1002/acp.1742
- Bernard J. Jansen, Kathleen Moore, and Stephen Carman. 2013. Evaluating the performance of demographic targeting using gender in sponsored search. Information Processing & Management 49, 1 (2013), 286–302. https://doi.org/10.1016/j.ipm.2012.06.001
- Kai Kaspar and Peter König. 2011. Overt Attention and Context Factors: The Impact of Repeated Presentations, Image Type, and Individual Motivation. PLOS ONE 6, 7 (07 2011), 1–15. https://doi.org/10.1371/journal.pone.0021719
- Nayeon Kim and Hyunsoo Lee. 2021. Assessing Consumer Attention and Arousal Using Eye-Tracking Technology in Virtual Retail Environment. Frontiers in Psychology 12 (08 2021). https://doi.org/10.3389/fpsyg.2021.665658
- Anastasia Kononova, Wonkyung Kim, Eunsin Joo, and Kristen Lynch. 2020. Click, click, ad: the proportion of relevant (vs. irrelevant) ads matters when advertising within paginated online content. International Journal of Advertising 39, 7 (2020), 1031–1058. https://doi.org/10.1080/02650487.2020.1732114
- Kyle Krafka, Aditya Khosla, Petr Kellnhofer, Harini Kannan, Suchendra Bhandarkar, Wojciech Matusik, and Antonio Torralba. 2016. Eye Tracking for Everyone. In IEEE Conference on Computer Vision and Pattern Recognition (CVPR).
- Eun Sook Kwon, Karen Whitehill King, Greg Nyila, and Leonard N Reid. 2019. Impact of Media Context On Advertising Memory. A Meta-Analysis Of Advertising Effectiveness. Journal of Advertising Research 104 (March 2019), 99–128.
- Joowon Lee and Jae-Hyeon Ahn. 2012. Attention to Banner Ads and Their Effectiveness: An Eye-Tracking Approach. International Journal of Electronic Commerce 17 (10 2012), 119–137. https://doi.org/10.2307/41739506
- Karen Nelson-Field. 2020. The Attention Economy and How Media Works. Palgrave Macmillian, Singapore.
- Jacob Lund Orquin and Michel Wedel. 2020. Contributions to attention based marketing: Foundations, insights, and challenges. Journal of Business Research 111 (2020), 85–90. https://doi.org/10.1016/j.jbusres.2020.02.012
- Playground XYZ. 2019. Attention Time: Redefining How Marketers Measure and Optimize Ads in Real Time. https://playground.xyz/whitepaper.pdf Accessed: 2022-07-23.
- Marc L. Resnick and William Albert. 2016. The Influences of Design Esthetic, Site Relevancy and Task Relevancy on Attention to Banner Advertising. Interacting with Computers 28, 5 (2016), 680–694. https://doi.org/10.1093/iwc/iwv042
- Irene Santoso, Malcolm Wright, Giang Trinh, and Mark Avis. 2021. Mind the attention gap: how does digital advertising impact choice under low attention?European Journal of Marketing 56, 2 (12 2021), 442–446. https://doi.org/10.1108/EJM-01-2021-0031
- Václav Stříteský, Marek Stritesky, Martin Quigley, and David Říha. 2016. Significance of Demographic Variables for Targeting of Internet Advertisements. Business, Management and Education 14 (06 2016), 1–18. https://doi.org/10.3846/bme.2016.277
- Thales S. Teixeira. 2014. The Rising Cost of Consumer Attention: Why You Should Care, and What You Can Do about It. Working Paper 14-055. Harvard Business School, Boston.
- Alex Wang. 2006. Advertising Engagement: A Driver of Message Involvement on Message Effects. Journal of Advertising Research - JAR 46 (12 2006). https://doi.org/10.2501/S0021849906060429
- Alex Wang. 2011. The contextual relevance effect on financial advertising. Journal of Financial Services Marketing 16 (06 2011), 50–64. https://doi.org/10.1057/fsm.2011.2
- Yi-Chia Wang, Moira Burke, and Robert Kraut. 2016. Modeling Self-Disclosure in Social Networking Sites. In Proceedings of the 19th ACM Conference on Computer-Supported Cooperative Work & Social Computing. 74–85. https://doi.org/10.1145/2818048.2820010
Permission to make digital or hard copies of all or part of this work for personal or classroom use is granted without fee provided that copies are not made or distributed for profit or commercial advantage and that copies bear this notice and the full citation on the first page. Copyrights for components of this work owned by others than the author(s) must be honored. Abstracting with credit is permitted. To copy otherwise, or republish, to post on servers or to redistribute to lists, requires prior specific permission and/or a fee. Request permissions from permissions@acm.org.
ICCDA 2023, September 15–17, 2023, Guiyang, China
© 2023 Copyright held by the owner/author(s). Publication rights licensed to ACM.
ACM ISBN 979-8-4007-0057-6/23/09.
DOI: https://doi.org/10.1145/3629264.3629265