Multi-Modal LLM Assisted Visualization of Large Visualization Collections
DOI: https://doi.org/10.1145/3708035.3736044
PEARC '25: Practice and Experience in Advanced Research Computing, Columbus, OH, USA, July 2025
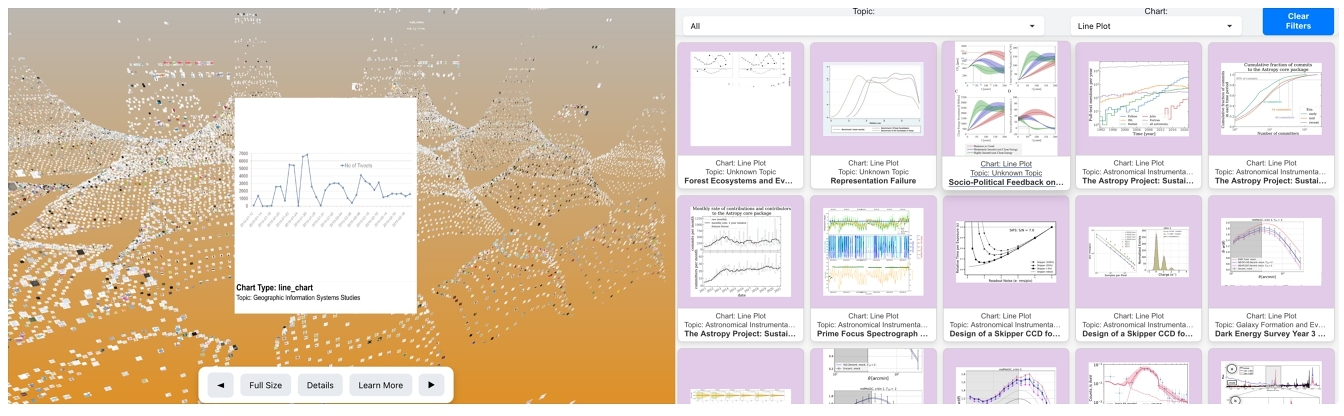
We present the ongoing work in a project named Vis-Sieve, which attempts to survey, characterize, and interactively explore a large collection of figures from publications. This effort aims to improve offerings of visualization service providers in the following ways: informed facility development, visualization technique discovery, development, trend analysis, and advanced practitioner discovery/recruitment. We build upon work within the fields of bibliometrics, information retrieval, and document analysis to assemble our collection. Of specific note for this article is our approach to flexible analysis and annotation of our collection by means of a multi-modal language model. This approach shows promising accuracy and saves researchers hours of effort, but still requires refinement over complications posed by how to label multipart figures. The end product will enable users to explore collections of 10,000 or more individual figures extracted from publications, as demonstrated by the draft of our visualization interface (https://iszhiyangwang.github.io/MMLLA/).
ACM Reference Format:
Zhiyang Wang, Devin Bayly, and Carolina Roe-Raymond. 2025. Multi-Modal LLM Assisted Visualization of Large Visualization Collections. In Practice and Experience in Advanced Research Computing (PEARC '25), July 20--24, 2025, Columbus, OH, USA. ACM, New York, NY, USA 4 Pages. https://doi.org/10.1145/3708035.3736044
1 Introduction
Visualization as a field helps researchers make sense of large volumes of information, but requires careful decision making and design considerations. Rather than assume that individuals become expert visualization practitioners in their limited free time, institutions sometimes employ a service provider to consult on the visualization process. In most cases, the service provider consists of only a small team or individual, yet is expected to support the visualization needs of the entire university.
Two of the authors of this article are in this position and can speak about some of the primary challenges. Consultation requests, for instance, can come from researchers representing diverse disciplines, which can vary widely not only among themselves but also from the service provider's own domain expertise. It can therefore be challenging to discern what visualization standards already exist in the researcher's field. Consulting the relevant literature is helpful but becomes a significant time investment just to first understand the field's prevalent visual encodings. Furthermore, when determining where to focus our efforts, we lack visibility into which types of visualizations and tools are most commonly used across campus, and by extension, which areas most urgently need support. These are not insurmountable issues, but they can constrain a service provider's impact. Our project, Vis-Sieve, seeks to address these obstacles by allowing visualization service providers to quickly explore the wide range of visualizations produced across their institution. The project starts by gathering open-access publications from an institution's researchers, then extracting the figures from the publications, adding labels, and finally presenting the figures and associated labels in an interactive web interface. The overarching goal is to give service providers a more efficient way to view visualization trends in unfamiliar domains, while also providing support for informed facility development, trend tracking, technique discovery/development, service catalog entry inspiration, and advanced practitioner discovery and recruitment.
Because this project is still a work in progress, we would like to focus on a specific sub-task within this project: the automatic labeling of figures by chart type (e.g., bar chart, heatmap, scatter plot). Our implementation builds upon existing work within the AI4Vis realm by using OpenAI's ChatGPT-gpt-4o-2024-08-06 model to classify visualizations. Once labeled by the model, these figures become filterable within the system by chart type, enabling users to explore specific categories of visualization quickly and effectively. This becomes a powerful tool for insight building, and time saving in the hands of a visualization support service provider.
1.1 Related Work
This project specifically builds on work within the field of AI4Vis, and document analysis. A useful characteristic of work in these fields is whether the research project develops it's own collection of visualizations or annotation taxonomy [5][21][20][6], or relies on published datasets or taxonomies from the internet [8]. We can also consider whether a visualization is the output [13][9][18] or the input [10][19][12][20] of a tool. We align with these characterizations because our project both generates a collection, and performs analysis on collection entries. We diverge from established projects by aiming to provide visualization consulting service providers with the ability to generate large institutional visualization collections (>30k images), and to automatically apply their own flexible chart type labels to elements in the collection for later interactive visualization.
2 Methods
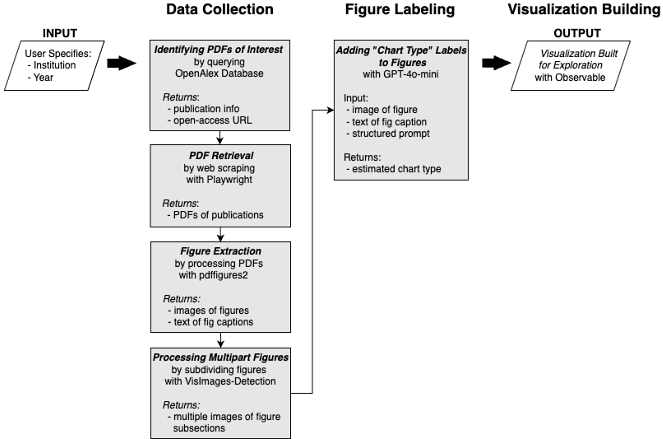
Our work was divided into three phases: 1) data collection by extracting pdfs and their figures, 2) labeling the extracted figures, and 3) visualizing the data for exploration.
2.1 Data Collection
2.1.1 PDF Retrieval. To assemble a representative corpus of academic publications, we leveraged the OpenAlex framework in conjunction with the Playwright browser automation library to systematically download PDFs [3][17]. We picked Princeton University's 2022 research output as a sample dataset, resulting in a corpus of over 11,000 scholarly articles. The OpenAlex API provided bibliographic metadata, including titles, authors, abstracts, domain classifications, citation counts, and publication venues, enabling structured analysis across academic disciplines and impact levels.
To automate the PDF retrieval process, we developed a Python-based workflow using Playwright, allowing efficient navigation of journal pages and institutional repositories to obtain full-text publications. When multiple sources were available for the same paper, we prioritized direct or high-quality PDF versions. This approach minimized manual intervention, significantly streamlining the data collection phase.
2.1.2 Figure Extraction. After curating the corpus, we extracted figures and their associated captions from each PDF. We employed pdffigures2 to parse document layouts, retrieving text blocks, figure, and other structural elements such as figure descriptions [7]. Although many goals of this project only rely on presenting visualizations alone, it can be helpful for secondary tasks to have access to these contextual elements. Once identified, bounding boxes were computed to delineate figure regions from surrounding text. We then cropped and paired each figure with its corresponding caption, creating a structured dataset of standalone figure-caption pairs, an essential foundation for subsequent classification tasks.
2.1.3 Processing Multipart Figures. Although our pipeline can process multi-visualization figures to some extent, it proved difficult to monitor or verify how many sub-charts were actually recognized. If one figure contained, say, six charts but only five were identified, it was not always clear which chart was missing. To address this, we integrated VisImages-Detection, an open-source visualization detection tool trained on the VisImages dataset [8]. By first splitting each figure into individual sub-charts using VisImages-Detection's Faster R-CNN model, we could then classify each sub-chart separately and validate the outcomes more precisely. This approach boosted classification accuracy and made it significantly easier to confirm that all visualizations within a multi-panel figure had been properly isolated.
| VisImages Correct | VisImages Incorrect | Row Total | |
| Zero-shot Annotation Correct | 56 (both correct) | 33 (Zero-shot only) | 89 |
| Zero-shot Annotation Incorrect | 8 (VisImages only) | 3 (both incorrect) | 11 |
| Column Total | 64 | 36 | 100 |
2.2 Figure Labeling
To assign a chart type to each extracted figure, we used OpenAI's GPT-4o-mini model (2024-08-06) [2] to implement an automated zero-shot classification workflow. This eliminated the need for manual labeling or domain-specific model training. For every figure, we fed the model the image, its caption, and a structured prompt that presented a set of candidate chart categories (e.g., bar chart, heat map, network graph). The model returned the most probable chart type for that figure. The resulting chart type labels were then written to the database that underpin the interactive exploration of the image collection.
2.3 Visualization Interface Building
We developed a dual-mode interface for browsing the extracted figures: (1) a standard 2D dashboard for quick database queries and (2) a 3D free-exploration environment. The 3D component is implemented using Observable, Three.js, and D3.js, drawing inspiration from Google's t-SNE demonstrations [1] and the blog "Visualizing t-SNE Maps with Three.js" [11] Initially, we attempted to reduce the dimensionality via t-SNE, but the results were suboptimal in separating certain clusters of charts. To address this limitation, we leveraged the zero-shot classification labels and confidence scores to design a Treemap-like spatial layout. Each type of chart is first assigned a subregion proportional to its overall frequency in the dataset. Within that subregion, individual figures are placed at randomized coordinates. This approach clusters similar charts more effectively than t-SNE for our collection size, reducing visual overlap while preserving global structure.
3 Discussion
The Vis-Sieve project is still in development, but it has already made significant progress in enabling the exploration of a wide variety of visualizations produced at an institution. Although several steps could use refinement, the classification stage shows promising accuracy and saves researchers many hours of manual effort.
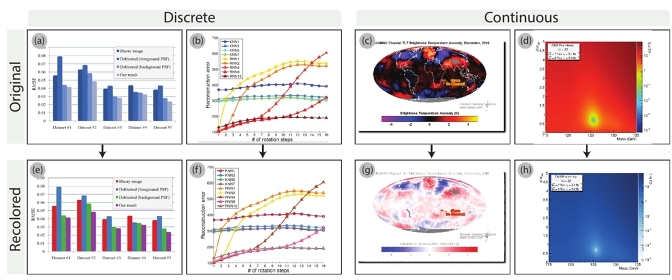
To evaluate the robustness of our classification pipeline, we retrieved random samples of figures and compared the labels generated by GPT-4o-mini's model to first, our own manual labels and second, to labels assigned by the public VisImages dataset [8]. For the comparison to manual labels, we conducted three rounds of random sampling on the dataset (100 images per round), and found an average manual verification accuracy of 91.2%. Encouraged by these initial results, we then used the public VisImages dataset for a more direct comparison. In the first test, many VisImages samples contained multiple sub-visualizations, posing challenges for a direct one-to-one label match. As a result, we adopted a partial matching approach: if a label assigned by both VisImages and zero-shot annotation was present in the image, it was considered a match, and only images that had no shared label were deemed unmatched. This resulted in approximately 65.2%–81.2% matches for labeled cases, but the methodology was imperfect due to the inherently multi-label nature of some figures. For example, the extracted visualization in Figure 3 could be labeled with bar chart, line chart, map, or heatmap/2D-density-plot labels, and all would be valid.
To refine the comparison, we isolated each sub-visualization within a figure before classification, thus ensuring a one-to-one mapping between an image region and a chart label. Across 35,016 isolated sub-visualizations, we observed 20,539 matches and 14,477 mismatches (58.64% matches). Mismatches did not necessarily imply a clear error: in some cases, labels diverged due to different, yet valid, interpretations of the same visual element.
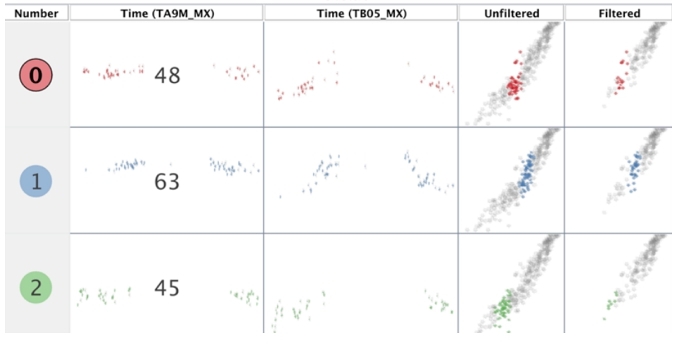
To probe this further, we selected 100 of these isolated images that produced mismatches for manual inspection. Table 1 shows that VisImages and zero-shot annotation both labeled 56 images correctly; 33 were correct only by zero-shot annotation, 8 only by VisImages, and 3 were labeled incorrectly by both methods, resulting in an overall accuracy of 89%. We also discovered examples where both labels were different but arguably correct. Figure 4 read as a scatter plot by VisImages but interpreted as a table by zero-shot annotation when viewed at a broader scale—underscoring the subjective aspects of visualization classification.
Cost and scalability between manual and automated labeling were also evaluated, with automated labeling coming out as the clear winner. Labeling 35,016 images cost approximately $32.69 in API usage. A single script processed 5–8 images per minute; parallelization could lower runtime. Manual labeling at 5 images per minute would require about 116.72 labor hours and cost roughly $2,334.40 (assuming $20/hour). This price difference favors automated classification for institutions needing to label tens of thousands of figures rapidly and cost-effectively.
Our findings highlight both the benefits and inherent complexities of automating multifaceted visual content labeling, and although our application pipeline effectively processes collections and supports analysis, some steps yield diminishing returns, prompting us to explore methods to alleviate these compounded limitations.
4 Conclusion & Future Work
This article presents the progress made in the Vis Sieve project, which builds a system that provides publication retrieval, visualization extraction, automated analysis, and subsequent visualization to support small teams of visualization service providers for large research institutions. When it comes to labeling visualizations, the use of zero-shot classification highlights the potential for minimizing manual annotation efforts, making this method particularly valuable for institutions seeking scalable solutions for visualization analysis. This work also showcases a successful cross institution collaboration with student engagement at its core.
In the future we hope to expand our visualization interface to support a presentation of the image collection in 3D using similarity scores between images. This will involve creating Vision Transformer embeddings for each visualization. Following embedding, we will project high-dimensional vectors into lower-dimensional space for exploration. Using t-SNE and UMAP, we preserved both local and global relationships, allowing clusters of similar visualization types to emerge [14][15]. This representation of our visualization collection may allow for more rapid exploration without requiring a categorical taxonomy to be provided at all. We welcome collaborators on this project; if you're interested, please reach out to Devin or Carolina.
Acknowledgments
Dr. Iqbal Hossain for consultation on future directions
References
- 2018. t-SNE Map by Cyril Diagne, Nicolas Barradeau & Simon Doury - Experiments with Google. https://experiments.withgoogle.com/t-sne-map
- 2024. ChatGPT. https://openai.com/index/gpt-4o-mini-advancing-cost-efficient-intelligence/
- 2025. playwright: A high-level API to automate web browsers.
- Zafar Ahmed and Chris Weaver. 2012. An adaptive parameter space-filling algorithm for highly interactive cluster exploration. In 2012 IEEE Conference on Visual Analytics Science and Technology (VAST). 13–22. https://doi.org/10.1109/VAST.2012.6400493
- Leilani Battle, Peitong Duan, Zachery Miranda, Dana Mukusheva, Remco Chang, and Michael Stonebraker. 2018. Beagle: Automated Extraction and Interpretation of Visualizations from the Web. In Proceedings of the 2018 CHI Conference on Human Factors in Computing Systems. ACM, Montreal QC Canada, 1–8. https://doi.org/10.1145/3173574.3174168
- Jian Chen, Meng Ling, Rui Li, Petra Isenberg, Tobias Isenberg, Michael Sedlmair, Torsten Möller, Robert S. Laramee, Han-Wei Shen, and Katharina Wünsche. 2021. Vis30k: A collection of figures and tables from ieee visualization conference publications. IEEE Transactions on Visualization and Computer Graphics 27, 9 (2021), 3826–3833. https://ieeexplore.ieee.org/abstract/document/9337213/ Publisher: IEEE.
- Christopher Clark and Santosh Divvala. 2016. PDFFigures 2.0: Mining Figures from Research Papers. In Proceedings of the 16th ACM/IEEE-CS on Joint Conference on Digital Libraries. ACM, Newark New Jersey USA, 143–152. https://doi.org/10.1145/2910896.2910904
- Dazhen Deng, Yihong Wu, Xinhuan Shu, Jiang Wu, Siwei Fu, Weiwei Cui, and Yingcai Wu. 2022. VisImages: A fine-grained expert-annotated visualization dataset. IEEE Transactions on Visualization and Computer Graphics 29, 7 (2022), 3298–3311. https://ieeexplore.ieee.org/abstract/document/9729541/ Publisher: IEEE.
- Victor Dibia and Çağatay Demiralp. 2019. Data2Vis: Automatic Generation of Data Visualizations Using Sequence-to-Sequence Recurrent Neural Networks. IEEE Computer Graphics and Applications 39, 5 (Sept. 2019), 33–46. https://doi.org/10.1109/MCG.2019.2924636 Conference Name: IEEE Computer Graphics and Applications.
- Ao Dong, Wei Zeng, Xi Chen, and Zhanglin Cheng. 2019. VIStory: Interactive Storyboard for Exploring Visual Information in Scientific Publications. In Proceedings of the 12th International Symposium on Visual Information Communication and Interaction. ACM, Shanghai China, 1–8. https://doi.org/10.1145/3356422.3356430
- Douglas Duhaime. 2017. Visualizing TSNE Maps with Three.js. http://douglasduhaime.com/posts/visualizing-tsne-maps-with-three-js.html
- Florian Grötschla, Luca A. Lanzendörfer, Marco Calzavara, and Roger Wattenhofer. 2024. AEye: A Visualization Tool for Image Datasets. In 2024 IEEE Visualization and Visual Analytics (VIS). IEEE, 281–285. https://ieeexplore.ieee.org/abstract/document/10771081/
- Yuyu Luo, Xuedi Qin, Nan Tang, Guoliang Li, and Xinran Wang. 2018. DeepEye: Creating Good Data Visualizations by Keyword Search. In Proceedings of the 2018 International Conference on Management of Data. ACM, Houston TX USA, 1733–1736. https://doi.org/10.1145/3183713.3193545
- Laurens van der Maaten and Geoffrey Hinton. 2008. Visualizing data using t-SNE. Journal of machine learning research 9, Nov (2008), 2579–2605.
- Leland McInnes, John Healy, and James Melville. 2020. UMAP: Uniform Manifold Approximation and Projection for Dimension Reduction. https://doi.org/10.48550/arXiv.1802.03426 arXiv:1802.03426 [stat].
- Jorge Poco, Angela Mayhua, and Jeffrey Heer. 2018. Extracting and Retargeting Color Mappings from Bitmap Images of Visualizations. IEEE Transactions on Visualization and Computer Graphics 24, 1 (Jan. 2018), 637–646. https://doi.org/10.1109/TVCG.2017.2744320 Conference Name: IEEE Transactions on Visualization and Computer Graphics.
- Jason Priem, Heather Piwowar, and Richard Orr. 2022. OpenAlex: A fully-open index of scholarly works, authors, venues, institutions, and concepts. https://doi.org/10.48550/arXiv.2205.01833 arXiv:2205.01833 [cs].
- Yuanfeng Song, Xuefang Zhao, Raymond Chi-Wing Wong, and Di Jiang. 2022. RGVisNet: A Hybrid Retrieval-Generation Neural Framework Towards Automatic Data Visualization Generation. In Proceedings of the 28th ACM SIGKDD Conference on Knowledge Discovery and Data Mining. ACM, Washington DC USA, 1646–1655. https://doi.org/10.1145/3534678.3539330
- Xiao Xie, Xiwen Cai, Junpei Zhou, Nan Cao, and Yingcai Wu. 2018. A semantic-based method for visualizing large image collections. IEEE transactions on visualization and computer graphics 25, 7 (2018), 2362–2377. https://ieeexplore.ieee.org/abstract/document/8358974/ Publisher: IEEE.
- Yilin Ye, Rong Huang, and Wei Zeng. 2024. VISAtlas: An Image-Based Exploration and Query System for Large Visualization Collections via Neural Image Embedding. IEEE Transactions on Visualization and Computer Graphics 30, 7 (July 2024), 3224–3240. https://doi.org/10.1109/TVCG.2022.3229023 Conference Name: IEEE Transactions on Visualization and Computer Graphics.
- Jian Zhao, Mingming Fan, and Mi Feng. 2020. Chartseer: Interactive steering exploratory visual analysis with machine intelligence. IEEE Transactions on Visualization and Computer Graphics 28, 3 (2020), 1500–1513. https://ieeexplore.ieee.org/abstract/document/9174891/ Publisher: IEEE.
Footnote
⁎Both authors contributed equally to this research.
Permission to make digital or hard copies of part or all of this work for personal or classroom use is granted without fee provided that copies are not made or distributed for profit or commercial advantage and that copies bear this notice and the full citation on the first page. Copyrights for third-party components of this work must be honored. For all other uses, contact the owner/author(s).
PEARC '25, Columbus, OH, USA
© 2025 Copyright held by the owner/author(s).
ACM ISBN 979-8-4007-1398-9/25/07.
DOI: https://doi.org/10.1145/3708035.3736044