FaceExpressions-70k: A Dataset of Perceived Expression Differences
DOI: https://doi.org/10.1145/3721238.3730653
SIGGRAPH Conference Papers '25: Special Interest Group on Computer Graphics and Interactive Techniques Conference Conference Papers, Vancouver, BC, Canada, August 2025
Facial expressions are key to human communication, conveying emotions and intentions. Given the rising popularity of digital humans and avatars, the ability to accurately represent facial expressions in real time has become an important topic. However, quantifying perceived differences between pairs of expressions is difficult, and no comprehensive subjective datasets are available for testing. This work introduces a new dataset targeting this problem: FaceExpressions-70k. Obtained via crowdsourcing, our dataset contains 70,500 subjective expression comparisons rated by over 1,000 study participants1 We demonstrate the applicability of the dataset for training perceptual expression difference models and guiding decisions on acceptable latency and sampling rates for facial expressions when driving a face avatar.
ACM Reference Format:
Avinab Saha, Yu-Chih Chen, Jean-Charles Bazin, Christian Häne, Ioannis Katsavounidis, Alexandre Chapiro, and Alan Bovik. 2025. FaceExpressions-70k: A Dataset of Perceived Expression Differences. In Special Interest Group on Computer Graphics and Interactive Techniques Conference Conference Papers (SIGGRAPH Conference Papers '25), August 10--14, 2025, Vancouver, BC, Canada. ACM, New York, NY, USA, 11 Pages. https://doi.org/10.1145/3721238.3730653
1 Introduction
Digital human renders are popular in applications like social media, entertainment, and education [Nowak and Fox 2018]. Stimulated by the advent of head-mounted displays, photorealistic face avatars have been proposed as an avenue for immersive human interactions [Lombardi et al. 2018; 2021]. Ensuring that these representations are perceptually accurate and convey the intended non-verbal signals is a critical task for these applications [Rekik et al. 2024].
During interaction, humans exchange a wealth of unspoken information with each other using their faces. One particularly salient set of tools for this is facial expressions: the same sentence said with a smile or frown might convey completely different meanings. Although subtle in motion, they have a strong perceptual impact.
The accuracy of the expressions of an avatar is especially difficult to quantify. The popular field of difference metrics largely focuses on low-level features of images (e.g. contrast, spatial frequency, color) or geometry (e.g. curvature), but these descriptors ignore the unique meaning imparted by expressions. A dedicated expression metric is desirable, but difficult to create due to a lack of appropriate subjective data - there is no comprehensive dataset of perceived expressions that can be used to train or test such a model.
In this work, we introduce FaceExpressions-70k, a large-scale dataset to quantitatively evaluate expression accuracy. It includes 70,500 pairwise comparisons of facial expressions, rated by 1,021 participants over more than 8,000 hours. The dataset spans eight human faces and 61 distinct expressions, covering both inter-expression (e.g., comparing a smile to a wink) and intra-expression pairs (e.g., the same expression at varying intensities). Compared to prior efforts, FaceExpressions-70k is significantly larger and more diverse, which makes it more suitable for key applications such as training metrics or deep learning models (see Sec. 2.4).
FaceExpressions-70k was obtained and scaled using state-of-the-art subjective study methodologies. Extensive piloting was used to ensure the data was well-scaled, with an approximately uniform distribution of activation units within expressions. Sixty-one unique expressions were evaluated, each presented with five activation levels on at least one of 8 unique base identities. To enable the collection of such a large dataset, we employed remote collection via Amazon Mechanical Turk (AMT) [Amazon 2025], using customized selection criteria to ensure data quality. State-of-the-art techniques [Li et al. 2020] were employed to test subjective scores for consistency, perform statistical analyses, and interpret the results. We demonstrate the value of FaceExpressions-70k via two applications. First, we use our dataset to benchmark the performance of image difference metrics in predicting the perceived distances between expression pairs. We demonstrate that performance is significantly improved by using FaceExpressions-70k to train the models, paving the way for future dedicated expression distance metrics. Additionally, we employ our dataset to drive decisions for acceptable latency and sampling rates of facial expressions when driving an avatar.
2 Related Work
2.1 Datasets of Faces and Expressions
Several datasets that include facial expressions exist. The HUMBI dataset [Yu et al. 2020] captured multi-view data of body and face expressions of 772 unique subjects. However, the resolution of the scans is insufficient to allow viewing subtle facial details. Similarly, the FaceWarehouse dataset [Cao et al. 2014] offers 3D facial expression data of 150 subjects, but relies on low-resolution RGB-D sensors, restricting geometric precision. Finally, the MultiFace dataset [Wuu et al. 2022] provides synchronized recordings of 13 individuals performing over 60 diverse facial expressions and head poses. Their multi-camera system includes 2048 × 1334 resolution images, tracked 3D meshes, unwrapped textures, and metadata, which enables more precision in the modeling of fine facial details for applications like virtual reality and telepresence. Due to its high resolution, geometric accuracy, and expression diversity, we selected MultiFace as the baseline dataset for this work, creating a comprehensive set of subjective labels of expression similarity.
2.2 Representation Learning for Faces
Recent efforts have advanced facial behavior understanding by learning face-specific representations. Zheng et al. [2021] proposed FaRL, a framework that learns transferable facial representations by combining contrastive image-text pretraining with masked image modeling. Ma et al. [2023] introduced MAE-Face, a unified approach for facial affect analysis that leverages masked autoencoder pretraining and multi-modal fusion. Building on face-specific learning, several works further disentangle identity to enhance expression analysis. Ning et al. [2024] proposed a framework that combines representation learning with identity-adversarial training to disentangle identity information and improve facial expression analysis. Liu et al. [2024] introduced NorFace, which enhances facial action unit (AU) analysis and facial emotion recognition (FER) by normalizing identity features to reduce subject bias. Zhang et al. [2021] proposed a Deviation Learning Network, modeling expressions as deviations from identity to learn a compact, identity-invariant embedding.
2.3 Perceptual Studies of Faces, Expression
Subjective data on faces has been leveraged to optimize digital human rendering quality. Wolski et al. [2022] quantified the visibility of geometry distortions on untextured human faces. Although sufficient geometric detail and quality is needed to perceive expressions, this study only focused on neutral faces. FaceMap [Jiang et al. 2024] created a saliency map of the face, focusing on the visibility of texture and geometry distortions. While localized saliency information can correlate with expressivity, this was not part of the study.
Perceptual evaluations of expression have been conducted. Wallraven et al. [2008] studied the accuracy of animation techniques in reproducing expressions. Zibrek et al. [2019] studied the impact of photorealism for three expression types: friendly, unfriendly, and sad, finding that more photorealistic imagery enhances expressiveness. Tessier et al. [2019] studied the realism of pain expressions in avatars, concluding that the order of action unit activation impacts the perceived realism of the expression. Treal et al. [2021] studied the impact of body and postural movements on the empathic response to expressions of pain, concluding that it has a significant impact. While all these studies examine facial expressions, they focus on specific aspects of the problem (animation accuracy, photorealism, pain expressions), and as a consequence, are not suitable for a general quantitative model of expression accuracy.
2.4 Metrics and Quantifying Expression Accuracy
Mean Squared Error (MSE) and Mean Absolute Error (MAE) are commonly used in image processing tasks but lack perceptual alignment, focusing only on pixel differences. Structural Similarity Index (SSIM) [Wang et al. 2004] improves upon this by considering luminance, contrast, and structure. Learned Perceptual Image Patch Similarity (LPIPS) [Zhang et al. 2018] is a neural network-based metric that compares feature activations for perceptual similarity. Both SSIM and LPIPS are widely used in tasks like image quality assessment and image similarity due to their more substantial alignment with human perception. Recently, activations from pretrained models [Chen et al. 2020; He et al. 2015; Radford et al. 2021] have also been shown to be useful for various tasks involving human perception. While these methods can present good accuracy for general content, they are not tuned to facial expressions. As a result, their performances at predicting the perceived differences of expression changes are limited (see Sec. 4).
Specific to expressions, McDonnell et al. [2021] examine the perception of facial action units (AUs) in virtual human models. They examined 12 expressions, each at five activation levels for six digital characters. Analyzing the data, the authors draw conclusions on perceptual salience across facial regions, and study the influence of factors like race and sex. Similarly, Cipiloglu Yildiz [2023] developed a perceptual distance metric for 3D blendshape models using crowdsourced evaluations of 2,905 intra and inter-expression triplets, obtained from a single blendshape model with five expressions, 173 raters, and metric learning techniques that incorporate saliency and curvature. Both works focus on expressions but employ only virtual characters animated via blendshapes. In contrast, our study employs filmed captures of human subjects, thus avoiding the influence of the rendering and animation methods on the result. Furthermore, our dataset, comprising 70.5k intra- and inter-expression pairs from eight human faces and 61 expressions, annotated by 1021 raters over more than 8000 hours, is significantly more extensive, which makes it suitable for fine-tuning general-purpose visual computing algorithms, such as neural networks or metrics.
3 Development of FaceExpressions-70k
3.1 Content for FaceExpressions-70k dataset
We utilize the MultiFace dataset [Wuu et al. 2022] as the source of the images used to run our study. This repository features a diverse range of facial expressions, including distinct and highly prominent expressions, as well as nuanced variations. Moreover, the controlled imaging conditions in MultiFace ensured that our dataset provided consistent and representative data for studying facial expression differences, forming a robust basis for investigating perceptual variations and developing objective evaluation metrics.
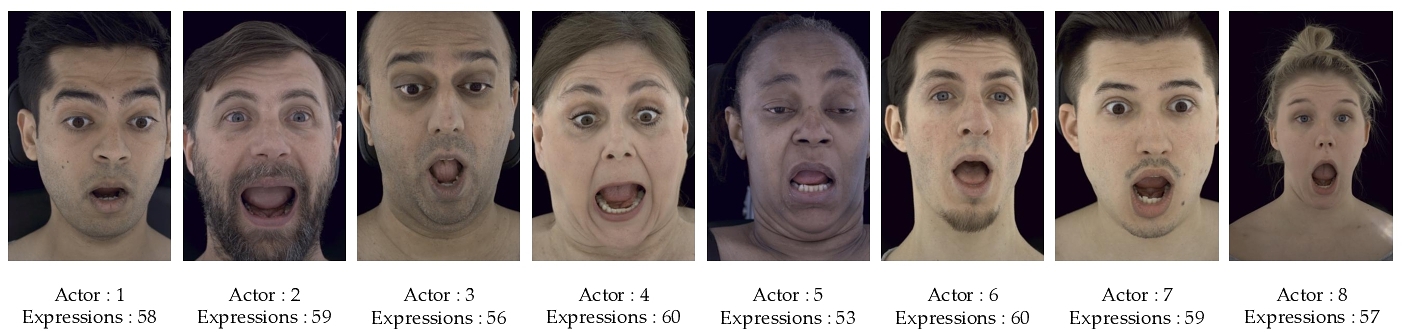
For this study, we sample frames from eight of the thirteen identities in the MultiFace dataset to maintain a feasible study size. This set was down-selected in a way that maintained as much demographic diversity as possible. See Appendix A.1 for an extended discussion of the identity selection process. We focus exclusively on front-facing camera captures, as this perspective minimizes pose variability, enhances the prominence of facial features, and provides a clear, uniform view, making the dataset particularly suitable for analyzing perceptual nuances in expression differences.
3.2 Sampling MultiFace Dataset
Facial expressions are transitional and often involve complex dynamics; in this work, we chose frame-based analysis as it provides more granular control, allowing us to examine different expressions at varying levels of activation.
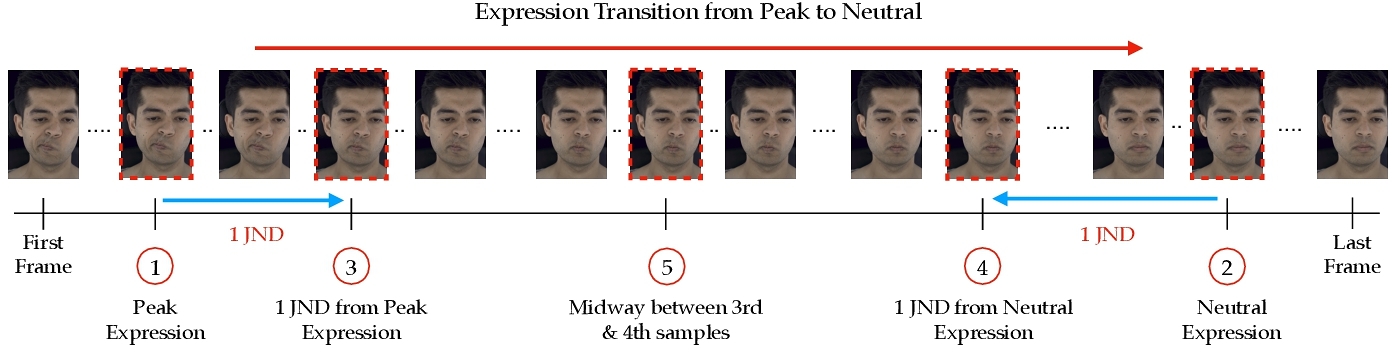
The MultiFace dataset provides video sequences capturing facial expression transitions from peak intensity to neutrality. In a video, many frames display imperceptible differences. To maintain a reasonable size, we want to ensure that the images down-selected for the study are reasonably perceptually spaced. Expression transitions occur non-linearly, with peak and neutral expressions often sustained at the beginning and end of each sequence. To ensure key points in the transition are captured, we sampled one frame early in the transition (e.g., frames 1–5), where the expression remained at its peak intensity, and another near the end (e.g., frames n − 5 to n), where the expression approached neutrality. Next, we ran one iteration of QUEST procedure [Watson and Pelli 1983] with 50 pairwise comparisons (See Appendix A.2 for more details). to identify another two frames: one that is 1 Just Noticeable Difference (JND) away from the peak expression, and another that is 1 JND away from the neutral expression as shown in Fig. 2. In total, 462 sequences across eight actors (53-60 per actor as shown in Fig. 3) were sampled in this way. To ensure a balanced representation of the transition, we also selected a midpoint frame between these two JND-determined frames. This sampling strategy resulted in 5 frames, emphasizing perceptually meaningful changes while offering a comprehensive and accurate depiction of expression dynamics. Figure 2 illustrates the sampling process. Five frames were deemed sufficient for our purposes based on informal trials using the QUEST method applied to expressions in this dataset, where we observed approximately 5-6 JNDs from peak to neutral.
3.3 Dataset Construction
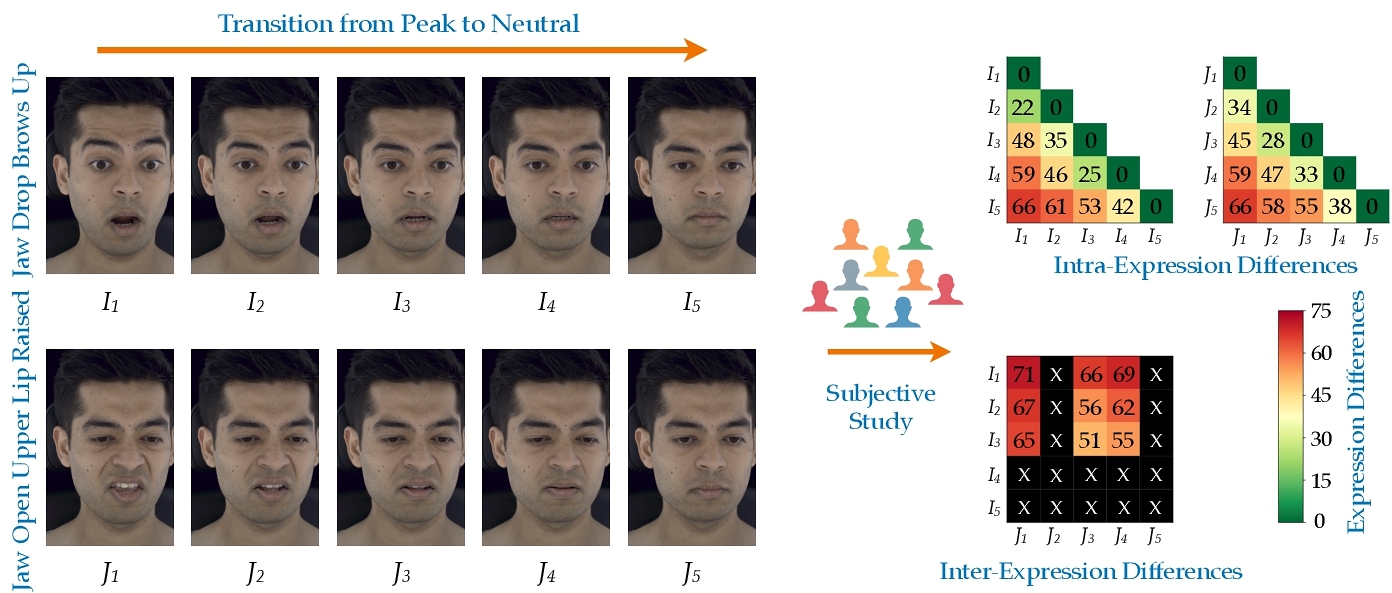
Following frame sampling from the expression transition sequences, paired image comparisons are created to prepare the dataset for subjective annotation. These are categorized in two sets:
- Intra-Expression Comparisons: Paired images were drawn from the same expression transition sequence, capturing variations between different intensities of the same expression. For each transition sequence, we generated $ \binom{5}{2} = 10$ comparisons, resulting in a total of 4,620 comparisons across 462 sequences.
- Inter-Expression Comparisons: To limit the number of comparisons, we executed two steps. First, we excluded the neutral images from both sequences and randomly selected 3 out of the 4 non-neutral images from each sequence, resulting in 3 × 3 = 9 comparisons across two expression transition sequences. Second, to further reduce the total number of comparisons, we used only half of all possible combinations of expression pairs ($ 0.5 \times \binom{61}{2} = 915$) per actor. Since not all expression sequences were available for every actor, we managed the allocation of inter-expression pairs to ensure each pair appeared four times in the final dataset while maintaining 915 pairs per actor. To accomplish this, we identified 1,830 inter-expression pairs and determined how many of the eight actors shared both expressions within each pair. Next, we sorted the list based on the number of actors. Starting with pairs involving the fewest actors, we allocated each expression pair to four actors using a round-robin approach. Consequently, this segment comprised a total of 915 × 8 (faces) × 9 = 65, 880 comparisons.
This results in a total of 70,500 comparisons, between both varying levels of the same expression and across distinct expressions.
3.4 Subjective Study
Given the dataset's size and the requirement for a large number of ratings per sample, an in-lab study was not feasible. Instead, we conducted an online study using AMT to gather ground-truth human opinion scores on facial expression differences. AMT has the advantage of enabling data collection from a diverse demographic, providing more representative ratings compared to in-lab studies, which are often restricted to homogenous groups, such as university students. To ensure data reliability, a rigorous methodology of quality control measures was employed to exclude unreliable participants (Sec. 3.4.3). Before conducting the large-scale study on AMT, we carried out a small in-lab pilot study with reliable subjects to validate our overall protocol.
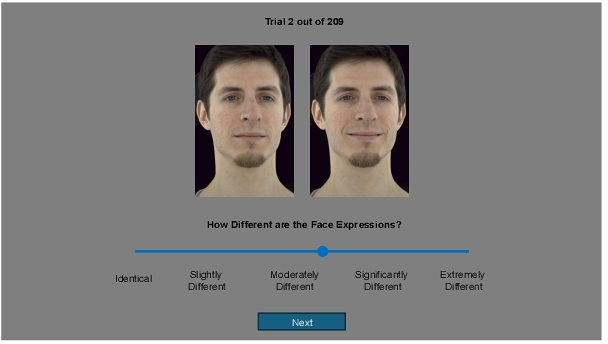
3.4.1 Data Organization and HIT. We organized all inter-expression and intra-expression sequences into 354 batches, each batch containing approximately 22 sequences. This resulted in around 200 image pair comparisons per batch for annotation. Each batch was carefully designed to include at least one sequence from one of the eight actors, as well as at least one sequence of intra-expression comparisons. These batches were then presented as Human Intelligence Tasks (HITs) on AMT for annotation. At the beginning of each rating session, all comparisons in the batch were randomly shuffled, and the two images in each pair were randomly assigned to appear on the left or right side of the screen. This was done to minimize any bias in the rating process across subjects related to the order of presentation or the positioning of the image pairs. Before raters could participate in the annotation process, each batch began with a training session designed to familiarize them with the rating process. This included example ratings of expression differences, helping raters understand the diversity of expression differences they would encounter during the task. A screenshot of the exemplar rating screen is shown in Fig. 4. The rating bar is initially set to zero (indicating ‘Identical’) for each trial, and users were required to adjust the bar based on their perceived expression difference.
3.4.2 Pilot Study. To fine-tune our method, we first validated the study protocol locally using a controlled group of subjects, before deploying it in large-scale crowdsourcing. We recruited 25 reliable participants from a cohort of graduate students and curated two batches for annotation that contained no overlap with the samples from the 354 main study batches. This pilot study was used to create a baseline for inter-subject correlations (Sec. 3.4.8), which measures agreement among human raters. An inter-subject correlation of 0.94 was found, which confirmed that our subjective testing methodology is reliable and produces valid results. This pilot also facilitated the creation of “golden samples,” which were subsequently used in the AMT study to monitor the rating quality of each HIT (Sec. 3.4.3).
3.4.3 Large Scale Subjective Study on AMT. After successfully validating our protocol via the in-lab pilot study, we opened the study to AMT workers, applying the qualification criteria (Section 3.4.4) and data quality monitoring measures (Section 3.4.5). The number of HITs was adjusted for each batch to ensure that, after rejecting inconsistent subjects, each batch retained 32 valid ratings. While the ITU-T recommends only 15–18 participants [Union 2004] for full-reference video quality assessment, we opted for a larger pool to enhance reliability as our study operates on a very novel stimulus type (expressions) and to account for noise stemming from crowdsourcing. We later show that the study achieved a high degree of inter-subject correlation, validating this decision. For each batch in the AMT study, we implemented two strategies to monitor data quality, incorporating five example cases for each strategy.
- Golden Samples: To evaluate subjects’ understanding, “golden samples” with known expression difference values were included in each session. Since FaceExpressions-70k is the first database of its kind, five data samples from the pilot study were selected, and their mean opinion scores were used as reference values for the rejection criteria. Five samples were randomly selected from both extremes of the expression difference spectrum, with low standard deviations in predicted differences, as less ambiguous samples are more effective for checks.
- Repeated Trials: To assess subject reliability, five randomly selected samples from each batch were repeated twice during the study, with the consistency between the two trials contributing to the rejection criteria.
3.4.4 Subject Qualification on AMT. To ensure reliable and high-quality data collection, we implemented strict qualifications for AMT workers who could participate in our studies. Participants were required to have over 10,000 lifetime approved HITs and an approval rate exceeding 90%, signaling their experience and reliability. Workers were also restricted from rating the same batch of expression comparisons more than once to maintain consistency and reduce potential biases. Once qualified, participants could contribute to a maximum of 20 batches unless flagged for inconsistencies via our monitoring system, described next.
3.4.5 HIT Rejection Criterion and Inconsistent Rater Blocking. We also developed a data quality monitoring system to ensure the reliability of the collected data. Every HIT was monitored, and those with inconsistencies were rejected. HIT rejections were based on several criteria, including detecting if users provided identical ratings for all image pairs (standard deviation < 5), minimal slider movement (standard deviation < 5), deviations from golden scores obtained in the in-lab pilot study (>= 3 out of 5 violations), and rating consistency for repeated trials where scores deviated by 25 or more (>= 3 out of 5 violations). Additionally, HITs were rejected if the combined violations from golden score checks and consistency checks reached or exceeded 4 out of 10. In some cases, repeated HIT rejections led to subject blocking, with immediate blocking for violations of the first two criteria or for accumulating more than four rejected HITs.
3.4.6 Subject Rater Pool: Demography. We summarize the demographic statistics of AMT workers participating in our dataset in Table 1. We found that raters had diverse demographics, spanning genders, age groups (20-60+), and geographical regions. Prior research has shown that emotion recognition can be influenced by cultural and social factors, including race-based social categorization, which can lead to biases in recognizing emotions across different groups [Reyes et al. 2018]. As a consequence, this broad demographic base is likely to enhance FaceExpressions-70k applicability for facial expression analysis, and reduce possible biases from cultural, age-related, or gender-based variations.
| Demography Statistics | |||||
| Gender | Male | Female | Other | Prefer Not to Say | |
| Counts as % | 57.78% | 41.82% | 0.09% | 0.29% | |
| Age | 20-30 | 30-40 | 40-50 | 50-60 | Others |
| Counts as % | 32.12% | 43.58% | 10.87% | 10.38% | 3.03% |
| Location | North America | South America | Asia & Australia | Europe | Africa |
| Counts as % | 43.38% | 23.21% | 28.30% | 3.03% | 2.05% |
3.4.7 Processing of Raw Scores. Using the subjective methodology described above, we obtained a total of over 2.2 million subjective opinions from 1,021 unique subjects, with 32 ratings of expression differences per image pair. The ratings obtained in this manner were then processed to obtain a single expression difference score label per image pair in the dataset. The simplest method for calculating this is the Mean Opinion Score (MOS), determined by averaging the subjective ratings given to each pair of images.:

A more refined method for determining labels, which we adopt in this work, is presented in the SUREAL framework [Li et al. 2020], and uses Maximum Likelihood Estimates, grounded in the following subject rating model:

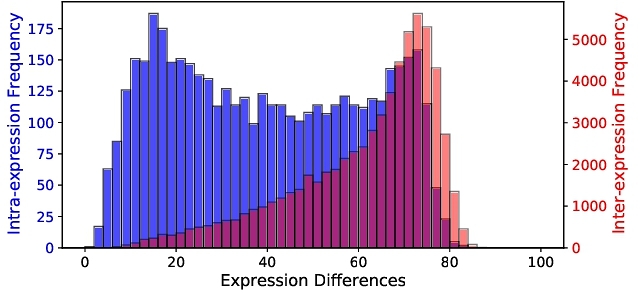
The distribution of the estimated SUREAL scores of face expression differences for all image pairs in the FaceExpressions-70k database is shown in Fig. 5, revealing a broad range of magnitudes of expression differences all falling within the range [1.88, 87.50]. The intra-expression pairs are shown in blue, while the inter-expression pairs are in red. The histogram for intra-expression differences is almost uniform, while the histogram for inter-expression differences is left-skewed. This is expected, as image pairs resulting from inter-expression differences, typically exhibit greater expression differences than those originating from intra-expression differences. The average standard deviation of the obtained expression difference scores was 2.8, in line with previous psychometric studies on video quality assessment using the SUREAL framework [Chen et al. 2024; Saha et al. 2023]. More discussions in Appendix A.3.
3.4.8 Inter-subject Correlation. To assess the reliability of subject ratings, we analyzed inter-subject correlation by dividing the ratings for each sample in the dataset into two random equal-size subsets. SUREAL scores were independently calculated for each subset, resulting in two quality labels per sample. The Spearman's Rank Order Correlation Coefficient (SROCC) was computed between these labels, and the process was repeated 50 times. The average SROCC across all iterations was used to quantify inter-subject correlation, with higher values reflecting greater agreement among subjects. The resulting inter-subject correlation was 0.914, typical of large-scale psychometric studies on AMT [Venkataramanan and Bovik 2024].
3.5 Analysis of Subjective Expression Difference Scores
In this section, we analyze subjective facial expression difference scores, exploring patterns of perceived expression similarity and distinctiveness to uncover key trends in human perceptual judgments. The findings show how subtle and dynamic facial changes contribute to the perception of expression differences.
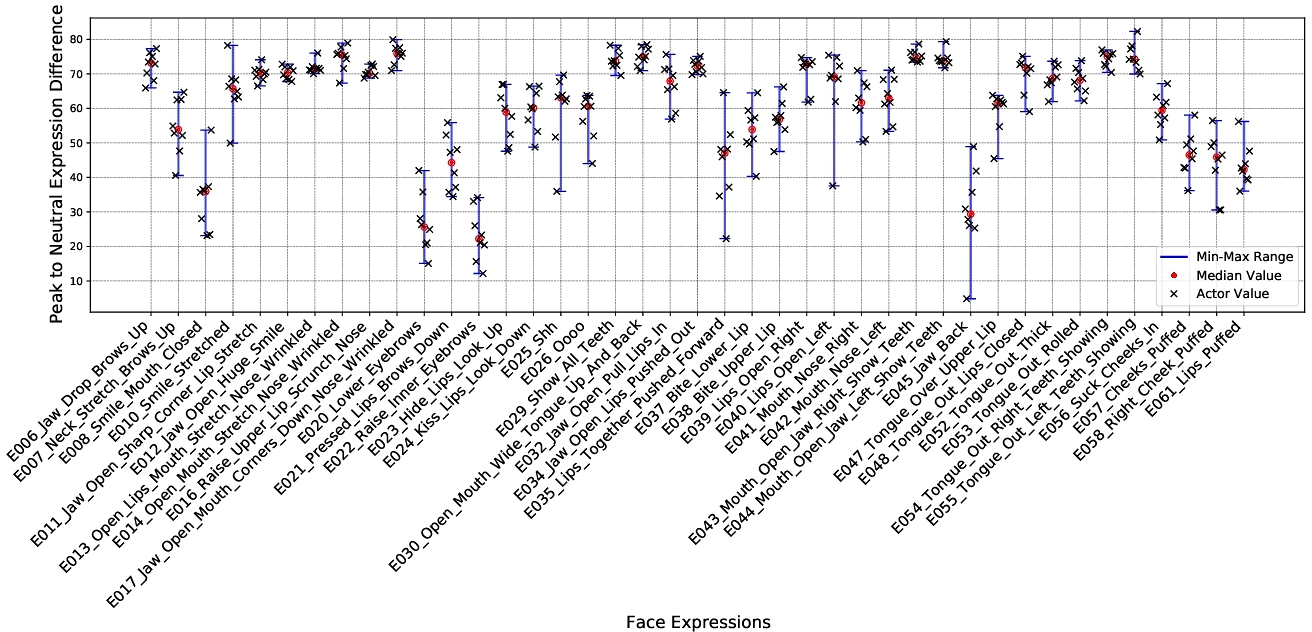
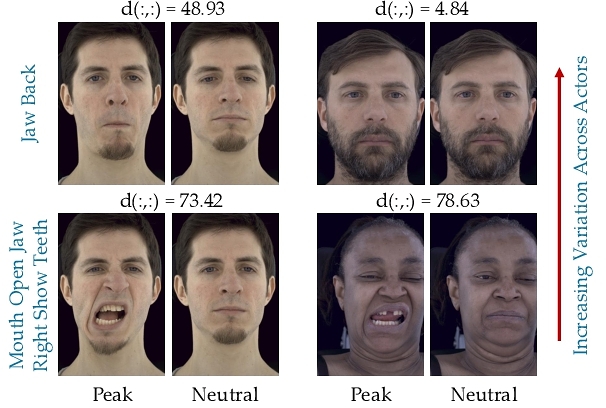
3.5.1 Variation in Peak to Neutral Expression Difference across Expressions. In Fig. 6, we plot the subjective expression differences between peak and neutral frames across eight actors for 41 expressions. The blue lines indicate the range of differences, showing the minimum-to-maximum variation across actors, while the red dots represent the median values for each expression and black ‘x’ for individual actor values. The plot reveals notable trends, with expressions such as “Lips Together Pushed Forward” and “Jaw Back” exhibiting large variability, indicating that the same expressions were perceived as being highly different across actors. In contrast, expressions like “Raise Upper Lip Scrunch Nose” and “Jaw Open Huge Smile” show narrow ranges, indicating a more uniform portrayal and perception across actors. Fig. 7 illustrates this phenomenon. High-intensity expressions, such as “Show All Teeth” and “Open Mouth Wide Tongue Up and Back,” exhibit higher median values, reflecting significant perceptual differences from neutral. By contrast, subtle expressions like “Raise Inner Eyebrows” show smaller differences, suggesting they are less perceptually distinct. Thus, subjective perception of facial expressions varies significantly across actors, with some expressions showing large variability and others being more consistently perceived. These observations highlight the complexity of subjective expression perception and the need to account for actor-specific variability when building robust facial expression differencing models.
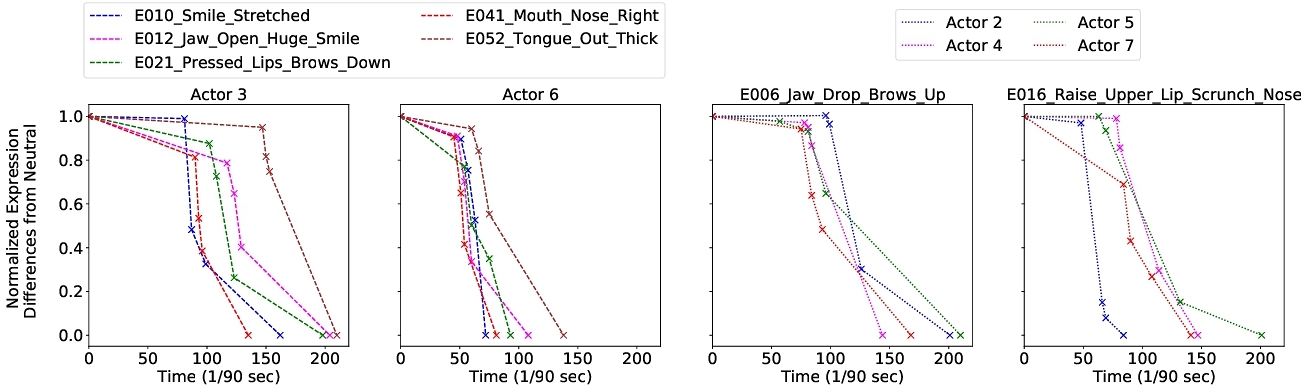
3.5.2 Variability in Expression Transitions. Expression transitions and differences from neutral are not uniform, varying across different actors and expressions for the same actor. Analyzing intra-sequence images reveals that expression differences from neutral vary significantly, both between actors and within the same actor across different expressions. Fig. 9 illustrates these trends by plotting the normalized expression differences from neutral: in the two plots on the left, actors are kept constant to analyze variability across expressions for the same actors, while in the two plots on the right, expressions are kept constant to examine variation across different actors for the same expressions. The transition back to neutral after reaching the full expression shows variability in timing and slope during the recovery phase. This highlights that individuals not only require different amounts of time to exhibit and recover from the same expression, but also show unique temporal patterns across different expressions, emphasizing the complex nature of expression dynamics, shaped by individual differences and expression-specific factors. More visualizations are in Appendix A.4.
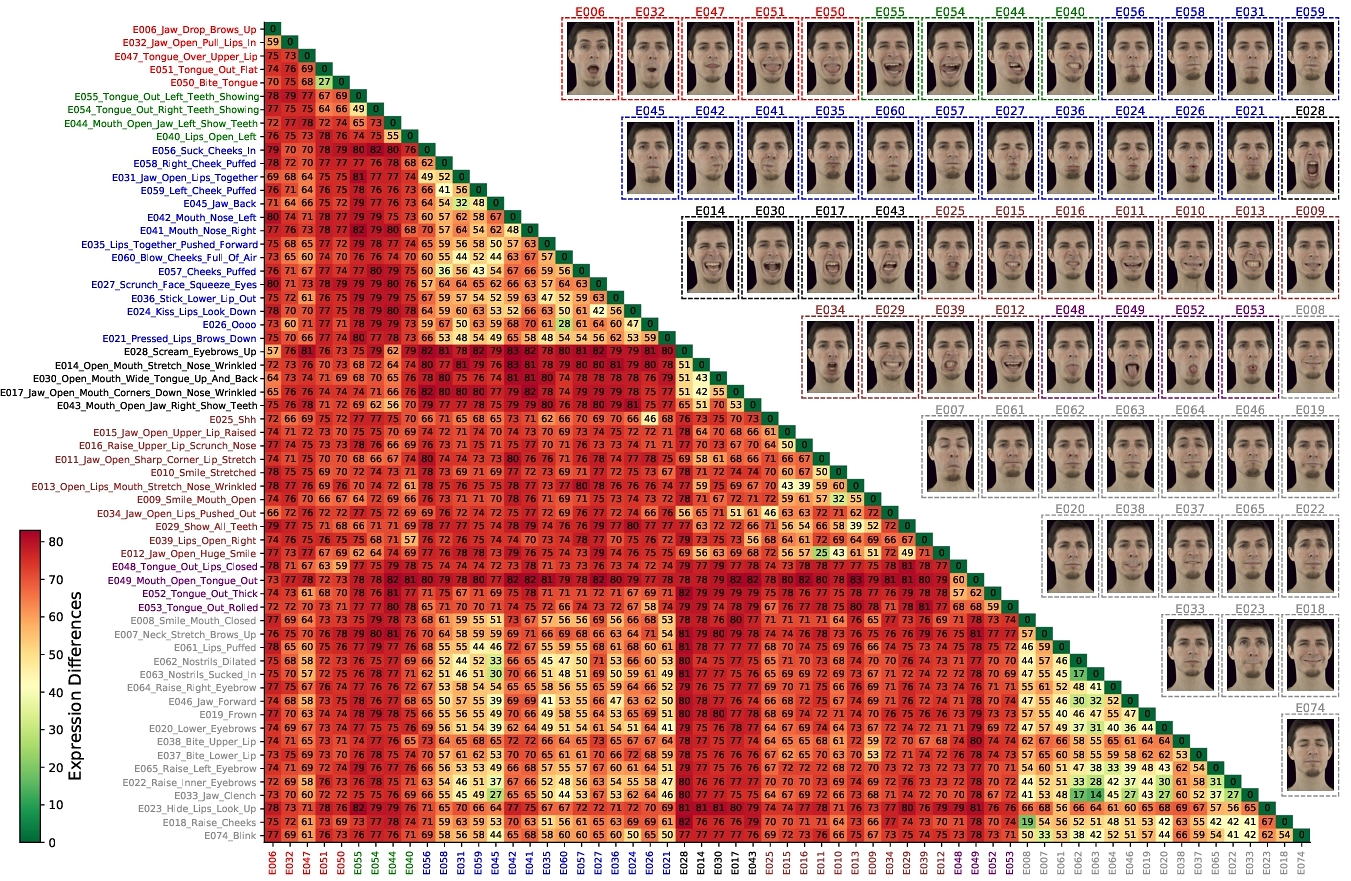
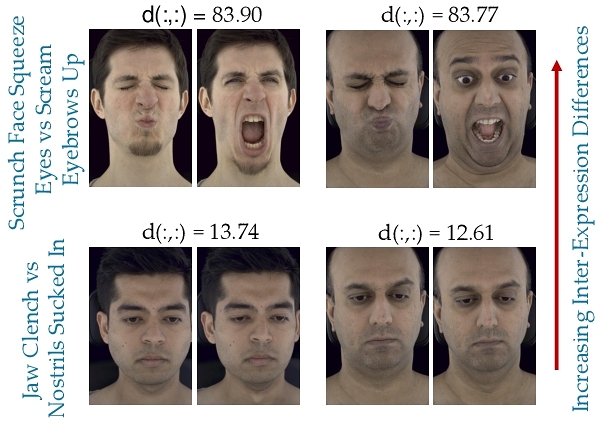
3.5.3 Inter-Expression Differences. Fig. 10 illustrates the mean pairwise facial expression differences across actors as a heatmap, where green shades represent lower differences and red indicates higher differences. One of the highest inter-expression differences is observed between “Scrunch Face Squeeze Eyes” and “Scream Eyebrows Up.” By contrast, minimal differences are found between the subtle expressions “Jaw Clench” and “Nostrils Sucked In.” Example comparisons are shown in Fig. 8. Using the inter-expression difference metric, we clustered the expressions with Hierarchical Agglomerative Clustering into 7 clusters (determined via the elbow method). Expressions within the clusters signify perceptually similar expressions, as determined by the clustering algorithm based on inter-expression difference scores. The clustered expressions are grouped and color-coded in Fig. 10. Expression differences near the diagonal appear in greenish-yellow hues, indicating low intra-cluster difference scores. By contrast, most of the other regions are shaded red, reflecting higher inter-cluster expression differences. We also demonstrate an application of using the inter-expression distances for expression rendering in Appendix A.5.
3.5.4 Effect of Asymmetrical Expressions on Expression Differences. Asymmetrical expressions, such as “Mouth Right Open” or “Mouth Left Open,” involve unilateral facial movements. We analyzed whether expression difference scores varied based on the direction of the expression to assess the impact of lateralization. For intra-expression sequences, we compared scores from “Right” and “Left” expressions using two-sample one-sided t-tests. The results (p-value = 0.23, t-statistic = 0.709) indicated no significant difference in the means. For inter-expression sequences, we compared the mean of the expression scores for right and left lateral movements against symmetric expressions using t-tests. Again, no statistically significant differences were found (p-value = 0.37, t-statistic = 0.331).
| Method | SROCC | PLCC | |
| Simple Fidelity Metrics |
Mean Squared Error Mean Absolute Error |
0.414 0.396 |
0.401 0.385 |
| Perceptual Image Similarity Metrics |
SSIM [Wang et al. 2004] LPIPS (AlexNet) [Zhang et al.. 2018] |
-0.146 0.435 |
-0.135 0.457 |
4 Metric Evaluation
This section provides a performance benchmark using commonly used metrics (see Sec. 2.4) on FaceExpressions-70k. The regression performance of these methods was evaluated using two metrics: Spearman's Rank-Order Correlation (SROCC) for monotonicity and Pearson's Correlation (PLCC) for prediction accuracy.
First, we tested image similarity metrics (Table 2). As expected, simple fidelity metrics had poor performance, emphasizing the specialized nature of the task. Both SSIM [Wang et al. 2004], commonly used for low-level perceptual distortion prediction, and LPIPS [Zhang et al. 2018] delivered weak performances, showing that these metrics are inadequate for predicting expression differences.
Next, we evaluated the zero-shot performance of various pretrained deep models, as well as the Blendshape model [Lewis et al. 2014], which utilizes facial deformation coefficients to capture expression variations. We extracted features from pretrained networks for the deep learning models, while the blendshape coefficients were obtained using the MediaPipe software [Google 2023]. Once the features for each image pair were extracted, two simple distance metrics—cosine similarity and L1 distance—were applied. The pretrained models include the widely used ImageNet-trained ResNet-50 in supervised [He et al. 2015], and self-supervised [Chen et al. 2020] settings. Additionally, we include the popular multimodal pretrained model CLIP [Radford et al. 2021], known for its remarkable versatility across various vision tasks. Finally, we include the pre-trained models for face-related tasks, including the face-specific models FaRL [Zheng et al. 2021], FMAE-IAT [Ning et al. 2024] and MAE-Face [Ma et al. 2023], designed to capture facial features more effectively. The results in Table 3 indicate that the L1 distance generally outperformed the cosine similarity. FaRL achieved the highest performance across the evaluation metrics, while the simple Blendshape model also demonstrated comparable performance when combined with the L1 distance. These results highlight the robustness of FaRL's feature extraction capabilities. However, the overall performances were moderate, suggesting the potential for significant improvements through more specialized architectures, fine-tuning with the FaceExpressions-70k dataset, or by the use of more specialized perceptual models. More discussion on evaluation metrics can be found in Appendix A.6.
5 Applications
5.1 Training Expressions Difference predictors
In Sec. 4, we benchmarked the performance of existing methods using the FaceExpressions-70k dataset. However, the dataset can also be utilized to train improved facial expression difference predictors. To demonstrate this, we extracted features from the best-performing method in Table 2, FaRL, and trained a support vector regressor (SVR) model using a linear kernel to regress from differences in embeddings to expression difference scores. The training was conducted using a 6:2 actor train-test split across 28 iterations, and the median performance was recorded. Following previous studies [Chen et al. 2024; Saha et al. 2023], this split was done along the “actor” variable to prevent content bias from influencing the test data. The SVR model achieved a relatively stronger performance, with an SROCC of 0.811 and a PLCC of 0.823. These results indicate that even simple regression models using features extracted from pre-trained models can improve expression difference prediction. This suggests that custom methods to measure expression differences could achieve even better performance.
| Method | Metric: Cosine Similarity |
Metric: L1 Distance |
|||||||||
| SROCC | PLCC | SROCC | PLCC | ||||||||
|
|
0.631 | 0.613 | 0.768 | 0.711 | ||||||
|
|
0.698 | 0.600 | 0.693 | 0.663 | ||||||
|
|
0.667 | 0.539 | 0.665 | 0.630 | ||||||
|
|
0.683 | 0.637 | 0.702 | 0.717 | ||||||
|
0.647 | 0.607 | 0.688 | 0.715 | |||||||
|
|
0.673 | 0.566 | 0.675 | 0.659 | ||||||
|
0.653 | 0.550 | 0.659 | 0.625 | |||||||
|
0.759 | 0.690 | 0.773 | 0.756 | |||||||
5.2 Face Avatars in Virtual Reality
In virtual reality applications, HMD (head-mounted display) cameras continuously track users’ facial expressions to ensure accurate face avatar generation. High tracking accuracy often requires dense sampling, which increases computational load. We demonstrate that the data from our crowdsourced study can be used to determine sampling intervals that avoid perceptible lag between the user's facial expressions and avatar counterpart while balancing efficiency. Another closely related application is determining the acceptable latency for driving face avatars in Virtual Reality, considering rendering, transmission, and other processing delays. Both applications require selecting time intervals to ensure no perceptible difference in expressions between the two sampled time stamps.
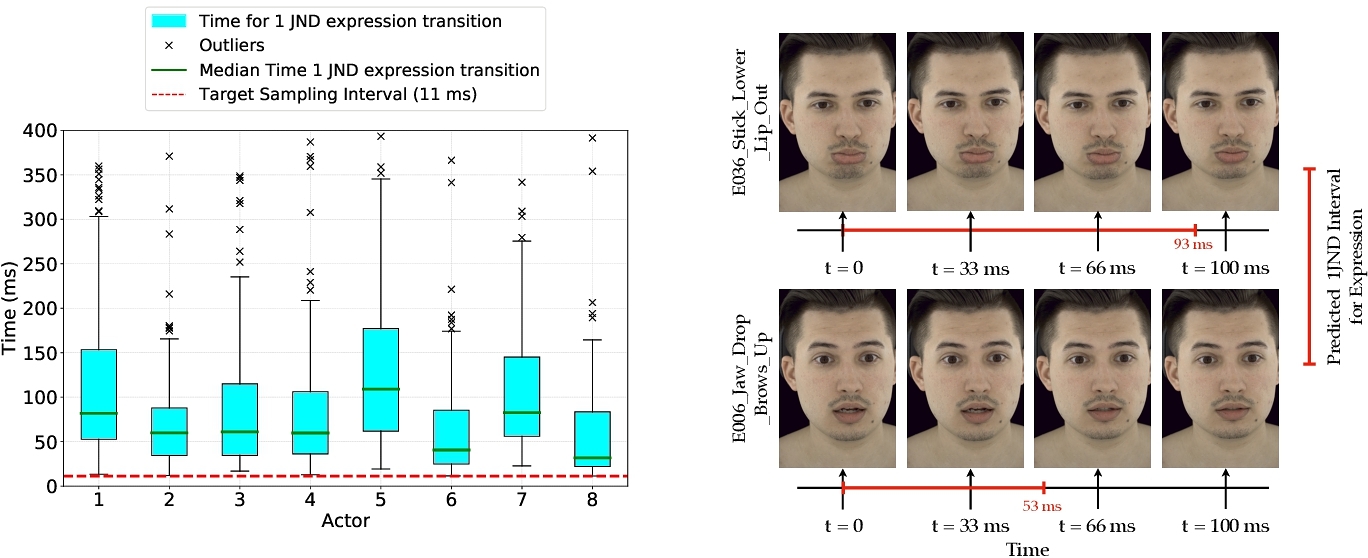
To achieve this, we first determine the expression difference magnitude corresponding to 1 JND, which we will use as a threshold. Leveraging our dataset design (see Fig. 2), we have an abundance of image pairs with annotated expression differences sampled 1 JND. We compute the median of these annotations, yielding an expression difference of 20.39. Next, using a linear expression transition approximation (valid only for small differences) between consecutive pairs of the three intermediate intra-sequence samples, we computed the transition time required for a 1 JND expression difference (20.39 MOS). This was repeated for each expression, and the per-actor statistics using box plots are shown in Fig. 11 (left). The first and last intra-expression samples were excluded, as the peak and neutral expressions were held constant and do not reflect expression transition dynamics reliably. From the figure, we observe that an approximate 11 ms (shown in red) interval, or 90 frames per second, ensured no perceptible expression difference across expression and actors. However, if we customized the selection for each actor, higher intervals could be used—for example, for actor 7, the interval could be as high as 22 ms. We further demonstrate the alignment of the predicted JND with visual perception for two expressions in Fig. 11 (right).
6 Conclusion and Future Work
In this work, we introduced FaceExpressions-70k, a large-scale dataset with over 70,500 crowdsourced comparisons to quantify perceived facial expression differences. Our analysis provides insights into both intra- and inter-expression differences across various expressions and actors. We also demonstrated the usefulness of FaceExpressions-70k through two applications: training expression difference models and making informed decisions on acceptable latency and sampling rates for facial expressions in avatar-driven systems. Future work could focus on building improved expression difference metrics. Accurate expression difference metrics could have diverse use cases, such as training face avatar models by employing them as perceptual loss functions. Further research on how expression differences are perceived from side and non-frontal perspectives could be interesting. Subjective studies on expression differences using 3D face models could also provide deeper insights into geometric variations and their perceptual impacts.
Acknowledgments
The authors acknowledge the Texas Advanced Computing Center (TACC), at the University of Texas at Austin, for providing HPC, visualization, database, and grid resources that have contributed to the research results reported in this paper. The authors would also like to acknowledge support for this research from the National Science Foundation AI Institute for Foundations of Machine Learning (IFML) under Grant 2019844, and from Meta Platforms. We thank Lucjan Janowski for helpful discussions and editorial feedback.
References
- Amazon. 2025. Amazon Mechanical Turk. https://www.mturk.com Accessed: 2025-01-08.
- Chen Cao, Yanlin Weng, Shun Zhou, Yiying Tong, and Kun Zhou. 2014. FaceWarehouse: A 3D Facial Expression Database for Visual Computing. IEEE Transactions on Visualization and Computer Graphics 20, 3 (2014), 413–425. https://doi.org/10.1109/TVCG.2013.249
- Xinlei Chen, Haoqi Fan, Ross Girshick, and Kaiming He. 2020. Improved Baselines with Momentum Contrastive Learning. arxiv:2003.04297 [cs.CV]
- Yu-Chih Chen, Avinab Saha, Alexandre Chapiro, Christian Häne, Jean-Charles Bazin, Bo Qiu, Stefano Zanetti, Ioannis Katsavounidis, and Alan C. Bovik. 2024. Subjective and Objective Quality Assessment of Rendered Human Avatar Videos in Virtual Reality. IEEE Transactions on Image Processing 33 (2024), 5740–5754. https://doi.org/10.1109/TIP.2024.3468881
- Zeynep Cipiloglu Yildiz. 2023. Learning a crowd-powered perceptual distance metric for facial blendshapes. J. Image Video Process. 2023, 1 (May 2023), 20 pages. https://doi.org/10.1186/s13640-023-00609-w
- Google. 2023. MediaPipe. https://github.com/google/mediapipe. Accessed: 2025-01-08.
- Kaiming He, Xiangyu Zhang, Shaoqing Ren, and Jian Sun. 2015. Deep Residual Learning for Image Recognition. arxiv:1512.03385 [cs.CV]
- Zhongshi Jiang, Kishore Venkateshan, Giljoo Nam, Meixu Chen, Romain Bachy, Jean-Charles Bazin, and Alexandre Chapiro. 2024. FaceMap: Distortion-Driven Perceptual Facial Saliency Maps. In SIGGRAPH Asia 2024 Conference Papers(SA ’24). Association for Computing Machinery, New York, NY, USA, Article 141, 11 pages. https://doi.org/10.1145/3680528.3687639
- J. P. Lewis, Ken Anjyo, Taehyun Rhee, Mengjie Zhang, Fred Pighin, and Zhigang Deng. 2014. Practice and Theory of Blendshape Facial Models. In Eurographics 2014 - State of the Art Reports, Sylvain Lefebvre and Michela Spagnuolo (Eds.). The Eurographics Association. https://doi.org//10.2312/egst.20141042
- Zhi Li, Christos G. Bampis, Lucjan Janowski, and Ioannis Katsavounidis. 2020. A simple model for subject behavior in subjective experiments. Electronic Imaging 2020, 11 (2020), 131–1.
- Hanwei Liu, Rudong An, Zhimeng Zhang, Bowen Ma, Wei Zhang, Yan Song, Yujing Hu, Wei Chen, and Yu Ding. 2024. Norface: Improving Facial Expression Analysis by Identity Normalization. arxiv:2407.15617 [cs.CV] https://arxiv.org/abs/2407.15617
- Stephen Lombardi, Jason Saragih, Tomas Simon, and Yaser Sheikh. 2018. Deep appearance models for face rendering. ACM Transactions on Graphics (ToG) 37, 4 (2018), 1–13.
- Stephen Lombardi, Tomas Simon, Gabriel Schwartz, Michael Zollhoefer, Yaser Sheikh, and Jason Saragih. 2021. Mixture of volumetric primitives for efficient neural rendering. ACM Transactions on Graphics (ToG) 40, 4 (2021), 1–13.
- Bowen Ma, Wei Zhang, Feng Qiu, and Yu Ding. 2023. A Unified Approach to Facial Affect Analysis: The MAE-Face Visual Representation. In Proceedings of the IEEE/CVF Conference on Computer Vision and Pattern Recognition. 5923–5932.
- Rachel McDonnell, Katja Zibrek, Emma Carrigan, and Rozenn Dahyot. 2021. Model for predicting perception of facial action unit activation using virtual humans.Comput. Graph. 100, C (Nov. 2021), 81–92. https://doi.org/10.1016/j.cag.2021.07.022
- Mang Ning, Albert Ali Salah, and Itir Onal Ertugrul. 2024. Representation Learning and Identity Adversarial Training for Facial Behavior Understanding. arxiv:2407.11243 [cs.CV]
- Kristine L Nowak and Jesse Fox. 2018. Avatars and computer-mediated communication: a review of the definitions, uses, and effects of digital representations. Review of Communication Research 6 (2018), 30–53.
- Alec Radford, Jong W. Kim, Chris Hallacy, Aditya Ramesh, Gabriel Goh, Sandhini Agarwal, Girish Sastry, Amanda Askell, Pamela Mishkin, Jack Clark, Gretchen Krueger, and Ilya Sutskever. 2021. Learning Transferable Visual Models From Natural Language Supervision. arxiv:2103.00020 [cs.CV] https://arxiv.org/abs/2103.00020
- Rim Rekik, Stefanie Wuhrer, Ludovic Hoyet, Katja Zibrek, and Anne-Hélène Olivier. 2024. A Survey on Realistic Virtual Human Animations: Definitions, Features and Evaluations. In Computer Graphics Forum. Wiley Online Library, e15064.
- Bryan N. Reyes, Sarah C. Segal, and Melody C. Moulson. 2018. An investigation of the effect of race-based social categorization on adults’ recognition of emotion. PLOS ONE 13, 2 (2018), e0192418. https://doi.org/10.1371/journal.pone.0192418
- Avinab Saha, Yu-Chih Chen, Chase Davis, Bo Qiu, Xiaoming Wang, Rahul Gowda, Ioannis Katsavounidis, and Alan C. Bovik. 2023. Study of Subjective and Objective Quality Assessment of Mobile Cloud Gaming Videos. IEEE Transactions on Image Processing 32 (2023), 3295–3310. https://doi.org/10.1109/TIP.2023.3281170
- Zaixi Shang, Joshua P. Ebenezer, Alan C. Bovik, Yongjun Wu, Hai Wei, and Sriram Sethuraman. 2022. Subjective Assessment Of High Dynamic Range Videos Under Different Ambient Conditions. In 2022 IEEE International Conference on Image Processing (ICIP). 786–790. https://doi.org/10.1109/ICIP46576.2022.9897940
- Marie-Hélène Tessier, Chloé Gingras, Nicolas Robitaille, and Philip L Jackson. 2019. Toward dynamic pain expressions in avatars: perceived realism and pain level of different action unit orders. Computers in Human Behavior 96 (2019), 95–109.
- Thomas Treal, Philip L. Jackson, Jean Jeuvrey, Nicolas Vignais, and Aurore Meugnot. 2021. Natural human postural oscillations enhance the empathic response to a facial pain expression in a virtual character. Scientific Reports 11, 1 (2021), 12493.
- International Telecommunication Union. 2004. Objective Perceptual Assessment of Video Quality: Full Reference Television. https://www.itu.int/ITU-T/studygroups/com09/docs/tutorial_opavc.pdf Accessed: 2024-01-08.
- Abhinau K. Venkataramanan and Alan C. Bovik. 2024. Subjective Quality Assessment of Compressed Tone-Mapped High Dynamic Range Videos. IEEE Transactions on Image Processing 33 (2024), 5440–5455. https://doi.org/10.1109/tip.2024.3463418
- Christian Wallraven, Martin Breidt, Douglas W Cunningham, and Heinrich H Bülthoff. 2008. Evaluating the perceptual realism of animated facial expressions. ACM Transactions on Applied Perception (TAP) 4, 4 (2008), 1–20.
- Zhou Wang, Alan C. Bovik, Hamid R. Sheikh, and Eero P. Simoncelli. 2004. Image quality assessment: from error visibility to structural similarity. IEEE Transactions on Image Processing 13, 4 (2004), 600–612. https://doi.org/10.1109/TIP.2003.819861
- Andrew B Watson and Denis G Pelli. 1983. QUEST: A Bayesian adaptive psychometric method. Perception & Psychophysics 33, 2 (1983), 113–120. https://doi.org/10.3758/BF03202828
- Krzysztof Wolski, Laura Trutoiu, Zhao Dong, Zhengyang Shen, Kevin MacKenzie, and Alexandre Chapiro. 2022. Geo-metric: A Perceptual Dataset of Distortions on Faces. ACM Transactions on Graphics (TOG) 41 (2022).
- Chenghsin Wuu, Ningyuan Zheng, Scott Ardisson, Rohan Bali, Danielle Belko, Eric Brockmeyer, Lucas Evans, Timothy Godisart, Hyowon Ha, Xuhua Huang, Alexander Hypes, Taylor Koska, Steven Krenn, Stephen Lombardi, Xiaomin Luo, Kevyn McPhail, Laura Millerschoen, Michal Perdoch, Mark Pitts, Alexander Richard, Jason Saragih, Junko Saragih, Takaaki Shiratori, Tomas Simon, Matt Stewart, Autumn Trimble, Xinshuo Weng, David Whitewolf, Chenglei Wu, Shoou-I Yu, and Yaser Sheikh. 2022. Multiface: A Dataset for Neural Face Rendering. arxiv:2207.11243 [cs.CV]
- Zhixuan Yu, Jae S. Yoon, In Kyu Lee, Prashanth Venkatesh, Jaesik Park, Jihun Yu, and Hyun Soo Park. 2020. HUMBI: A Large Multiview Dataset of Human Body Expressions. In 2020 IEEE/CVF Conference on Computer Vision and Pattern Recognition (CVPR). 2987–2997. https://doi.org/10.1109/CVPR42600.2020.00306
- Richard Zhang, Phillip Isola, Alexei A. Efros, Eli Shechtman, and Oliver Wang. 2018. The Unreasonable Effectiveness of Deep Features as a Perceptual Metric. In CVPR.
- Wei Zhang, Xianpeng Ji, Keyu Chen, Yu Ding, and Changjie Fan. 2021. Learning a Facial Expression Embedding Disentangled From Identity. In Proceedings of the IEEE/CVF Conference on Computer Vision and Pattern Recognition (CVPR). 6759–6768.
- Yinglin Zheng, Hao Yang, Ting Zhang, Jianmin Bao, Dongdong Chen, Yangyu Huang, Lu Yuan, Dong Chen, Ming Zeng, and Fang Wen. 2021. General Facial Representation Learning in a Visual-Linguistic Manner. arXiv preprint arXiv:2112.03109 (2021).
- Katja Zibrek, Sean Martin, and Rachel McDonnell. 2019. Is photorealism important for perception of expressive virtual humans in virtual reality?ACM Transactions on Applied Perception (TAP) 16, 3 (2019), 1–19.
Footnote
1The dataset will be released publicly at https://github.com/avinabsaha/face-expressions-70k following publication.
Authors' Contact Information: Avinab Saha, The University of Texas at Austin, Austin, USA, avinab.saha@utexas.edu; Yu-Chih Chen, The University of Texas at Austin, Austin, USA, berriechen@utexas.edu; Jean-Charles Bazin, Reality Labs, Meta, Sunnyvale, USA, jcbazin@meta.com; Christian Häne, Reality Labs, Meta, Sunnyvale, USA, chaene@meta.com; Ioannis Katsavounidis, Reality Labs, Meta, Sunnyvale, USA, ikatsavounidis@meta.com; Alexandre Chapiro, Reality Labs, Meta, Sunnyvale, USA, alex@chapiro.net; Alan Bovik, The University of Texas at Austin, Austin, USA, bovik@ece.utexas.edu.

This work is licensed under a Creative Commons Attribution 4.0 International License.
SIGGRAPH Conference Papers '25, Vancouver, BC, Canada
© 2025 Copyright held by the owner/author(s).
ACM ISBN 979-8-4007-1540-2/25/08.
DOI: https://doi.org/10.1145/3721238.3730653